

.500
The Padres reached the All-Star break 48-48, exactly .500. The first half included both an eight game win streak and, more recently, an eight game losing streak from June 27th through July 4th. They’re only 3.5 games behind the Marlins in the playoff race, hardly an insurmountable deficit. But it’s a more difficult task than it may seem. The Padres would need to play at a 96-win pace (39–27 over 66 games) for the rest of the season to match the Marlins current 87 win projection. It’s tempting to draw parallels to the 2024 season in which the Padres stood an even 50-50 after their first 100 games before surging to a 43-19 record in the second half to finish with a 93-69 record. But the two seasons are very different. And that matters because the trade deadline is less than three weeks away. Decisions have to be made. Decisions, we hope, that are made with a clear-eyed understanding of what can be expected of this year’s Padres team.
How did they get here?
It’s fair to say the Padres haven’t played like a .500 team. It hasn’t been a win-one, lose-one type of season. It’s been far more chaotic:
Courtesy: Darren Williams (@darenw)
A look under the hood suggests the recent performance regression is more indicative of the team’s quality than the .500 record. The Padres have scored 379 runs, dead last in baseball. They’ve allowed 422, which is a fairly good mark. But the -43 run differential is abysmal. It implies a Pythagorean record of 43-53, five games worse than their actual record.
Their offense produced a 90 wRC+ (10 percent below league average) after adjusting for park and league. Their starters had a 4.78 ERA and 4.61 FIP, suggesting the ERA has only been slightly worse than expected performance.
Their final turn at bat before the All-Star break offered a clean look at how they’ve maintained relevance despite immense areas of underperformance. Trailing the Blue Jays 4-3 in the bottom of the eighth on Sunday, the Padres managed yet another late inning rally, fueled by timely hitting, pressing the margins, and some luck going their way.
Xander Bogaerts led off with a jam shot infield single:
With Manny Machado at the plate, Bogaerts stole second:
Machado worked a full count and lined a single to center:
Gavin Sheets followed and hit a sharp groundball right at shortstop Andrés Jimenez for what looked like a sure double play ball:
Ernie Clement inexplicably didn’t cover second base, and the lapse turned Sheets’ grounder into a productive out.
The Padres then took the bold step of pinch running for Machado at second in a tied game in the 8th. Jase Bowen took a smart calculated risk, timing up Jeff Hoffman’s delivery perfectly and getting a great jump to steal third:
Alejandro Kirk did not attempt a throw on the play, Bowen’s jump may have been too good to attempt, though the third baseman appeared to be at the bag in time for a close play:
Whatever the reason, the uncontested stolen base would be consequential:
The second productive out of the inning scored the go ahead run. All year that’s been as big enough lead to win if they could carry it to the 9th. Mason Miller diced up the Blue Jays batters in the 9th on only eight pitches, ending the game with a ludicrous 0-2 slider that made one of the better hitters in baseball appear entirely overmatched:
An infield hit, two steals, one clean single, a lucky productive out ground ball, and a sac fly produced two runs. This sequence was a microcosm of the overperformance of the run differential. That was the first half compressed into one inning. The Padres are built well to take advantage of late leads, but have struggled massively to create consistent enough offense and early run prevention to maximize this advantage. Too often they’ve needed things to break their way to eke out late leads. This win was 12th this season in a game in which they trailed at some point in the 7th inning or later:
April 9 vs. Colorado: trailed in both the 10th and 11th; won 7–3 in 12 innings
April 15 vs. Seattle: trailed 6–2 entering the ninth; won 7–6
April 23 at Colorado: trailed 8–4 after seven; won 10–8
April 25 at Arizona: trailed 4–1 entering the seventh; won 6–4
May 10 vs. St. Louis: trailed 2–0 entering the ninth; won 3–2 in 10
May 13 at Milwaukee: trailed 1–0 entering the ninth; won 3–1
June 6 vs. New York Mets: fell behind 2–1 in the seventh; won 3–2
June 8 vs. Cincinnati: trailed 2–1 entering the seventh; won 6–2
June 10 vs. Cincinnati: fell behind in the seventh and again in the eighth; won 5–4
June 20 at Texas: trailed 3–1 entering the eighth; won 6–4 in 10
June 23 vs. Atlanta: trailed 6–5 entering the seventh; won 7–6 in 10
July 12 vs. Toronto: fell behind 4–3 in the eighth; won 5–4
That matches their total late inning comeback wins from 2025. They won 90 games in 2025, the 12 late comebacks representing 13.3% of their total victories. In 2026 their 12 late comebacks represent 25% of their 48 victories.
Timely hitting can win actual games, which are famously the only kind the standings count. It is simply difficult to carry that forward. As Sunday’s win showed it often requires factors that are out of the team’s direct control. Hoping for sustained good luck is not a plan. It’s very, very unlikely they can maintain even a .500 pace if they have to win a quarter of the games by overcoming late inning deficits.
The central question of the second half is not whether a .500 team can make the playoffs. Of course it can. It is whether the Padres can tilt the chaotic process that produced the .500 record to one which implies an ability not to just limp into the playoffs, but to then win sequential playoffs series. That’s a -very- tall order. And it demands sobriety. So let’s look at what really happened in the first half, and what a distilled prospectus suggests going forward.
Starting Rotation: Plan A
Plan A for the season was out the window by early April. The team lost its ace in what was already a rickety starting rotation when Nick Pivetta left his April 12 start after retiring all nine hitters he faced. He subsequently went on the injured list with a strained flexor tendon in his pitching arm and a highly uncertain return.
Nick Pivetta’s injury was the highest-leverage event of the first half because it did not merely remove one starting pitcher. It had second and third order effects that were a major part of the scuffling first half.
In his four starts Pivetta produced a career high 36.4% strikeout rate, while holding opposing hitters to a .539 OPS, and a career best 86.2 MPH average exit velocity, allowing no home runs, and pitching to a 1.23 FIP. He was missing bats at the level of a frontline starter when his elbow stopped cooperating. You could argue he was the Padres most important tentpole for a successful season.
We wrote about the likelihood the Padres could have absorbed such a loss with a tolerable impact to their season outlook if they could merely backfill Pivetta’s absence with replacement level1 production. This was Plan B, and the Padres expended resources signing Lucas Giolito, hoping that a patchwork of Matt Waldron and Giolito, along with the ramp up of Griffin Canning could cover Pivetta’s missing innings and produce somewhere near the minor league replacement level and league average, thus limiting the pain felt by the loss of Pivetta. Instead the team absorbed three months of replacement attempts that failed to produce replacement-level value.
Canning, Waldron, and Giolito combined to throw 111⅔ innings in which they allowed 79 earned runs, a 6.37 ERA, far below expected replacement level production. Canning finished the half with a 6.47 ERA. Waldron had a 7.52 ERA. Giolito had a 5.16 ERA with a 6.07 FIP and never pitched more than five innings in a start before hitting the IL June 23rd. This is fairly described as a catastrophic result.
The second order effect of Pivetta’s injury was a recurring tax on the bullpen. The failure of Plan B diminished the team’s biggest strength, its bullpen, in two ways:
Short starts forced the bullpen to cover more early innings. Covering early innings constrained the team’s ability to hunt optimal matchups later in the game, and
More innings to cover meant extra wear and tear on bullpen arms
Attrition has already started to hit the ranks of the bullpen with Jeremiah Estrada still out with no clear timetable for return, and the recent departure of Jason Adam with an injury that almost certainly means the end of his regular season. David Morgan is working his way back from an IL stint.
We can’t know the exact impact of the second order effects. But it’s unquestionably part of the first half struggle. Hard to quantify, even harder to miss.
Pivetta is likely to make a return sometime in August if for no other reason than it has major contractual implications, his 2027 $14 million salary becomes a club option if he is on the IL for over 130 straight days. There’s a non-zero possibility he could return in effective form some time in August. But it’s unlikely, and it shouldn’t be counted on when projecting the strength of the team down the stretch.
Plan C
Plan A and Plan B for the starting rotation failed spectacularly in the first half. The Padres are on to Plan C, hoping to soak up innings any way they can, including asking JP Sears to try to go three times through the order once every five games. Sears has been far worse as a Padre than he was with the A’s. Still, his floor is likely not worse than what Giolito produced. And there’s some reason to think that the innings they get from Waldron and Canning going forward will be better. Primarily because Canning and Waldron were so bad in the first half that it beggars belief this is the true talent level of the players.
Ceiling: Floor Raiser
Waldron has a track record suggesting he can perform at replacement level pitcher. He managed an effective outing in long relief, pitching three scoreless innings against Toronto on July 11. Notably, he threw 20 knuckleballs among 46 pitches, a 43.5 percent usage rate. Before that appearance, he had used the pitch only 24.7 percent of the time. Its velocity also rose slightly, from a season average of 80.5 mph to 81.2.
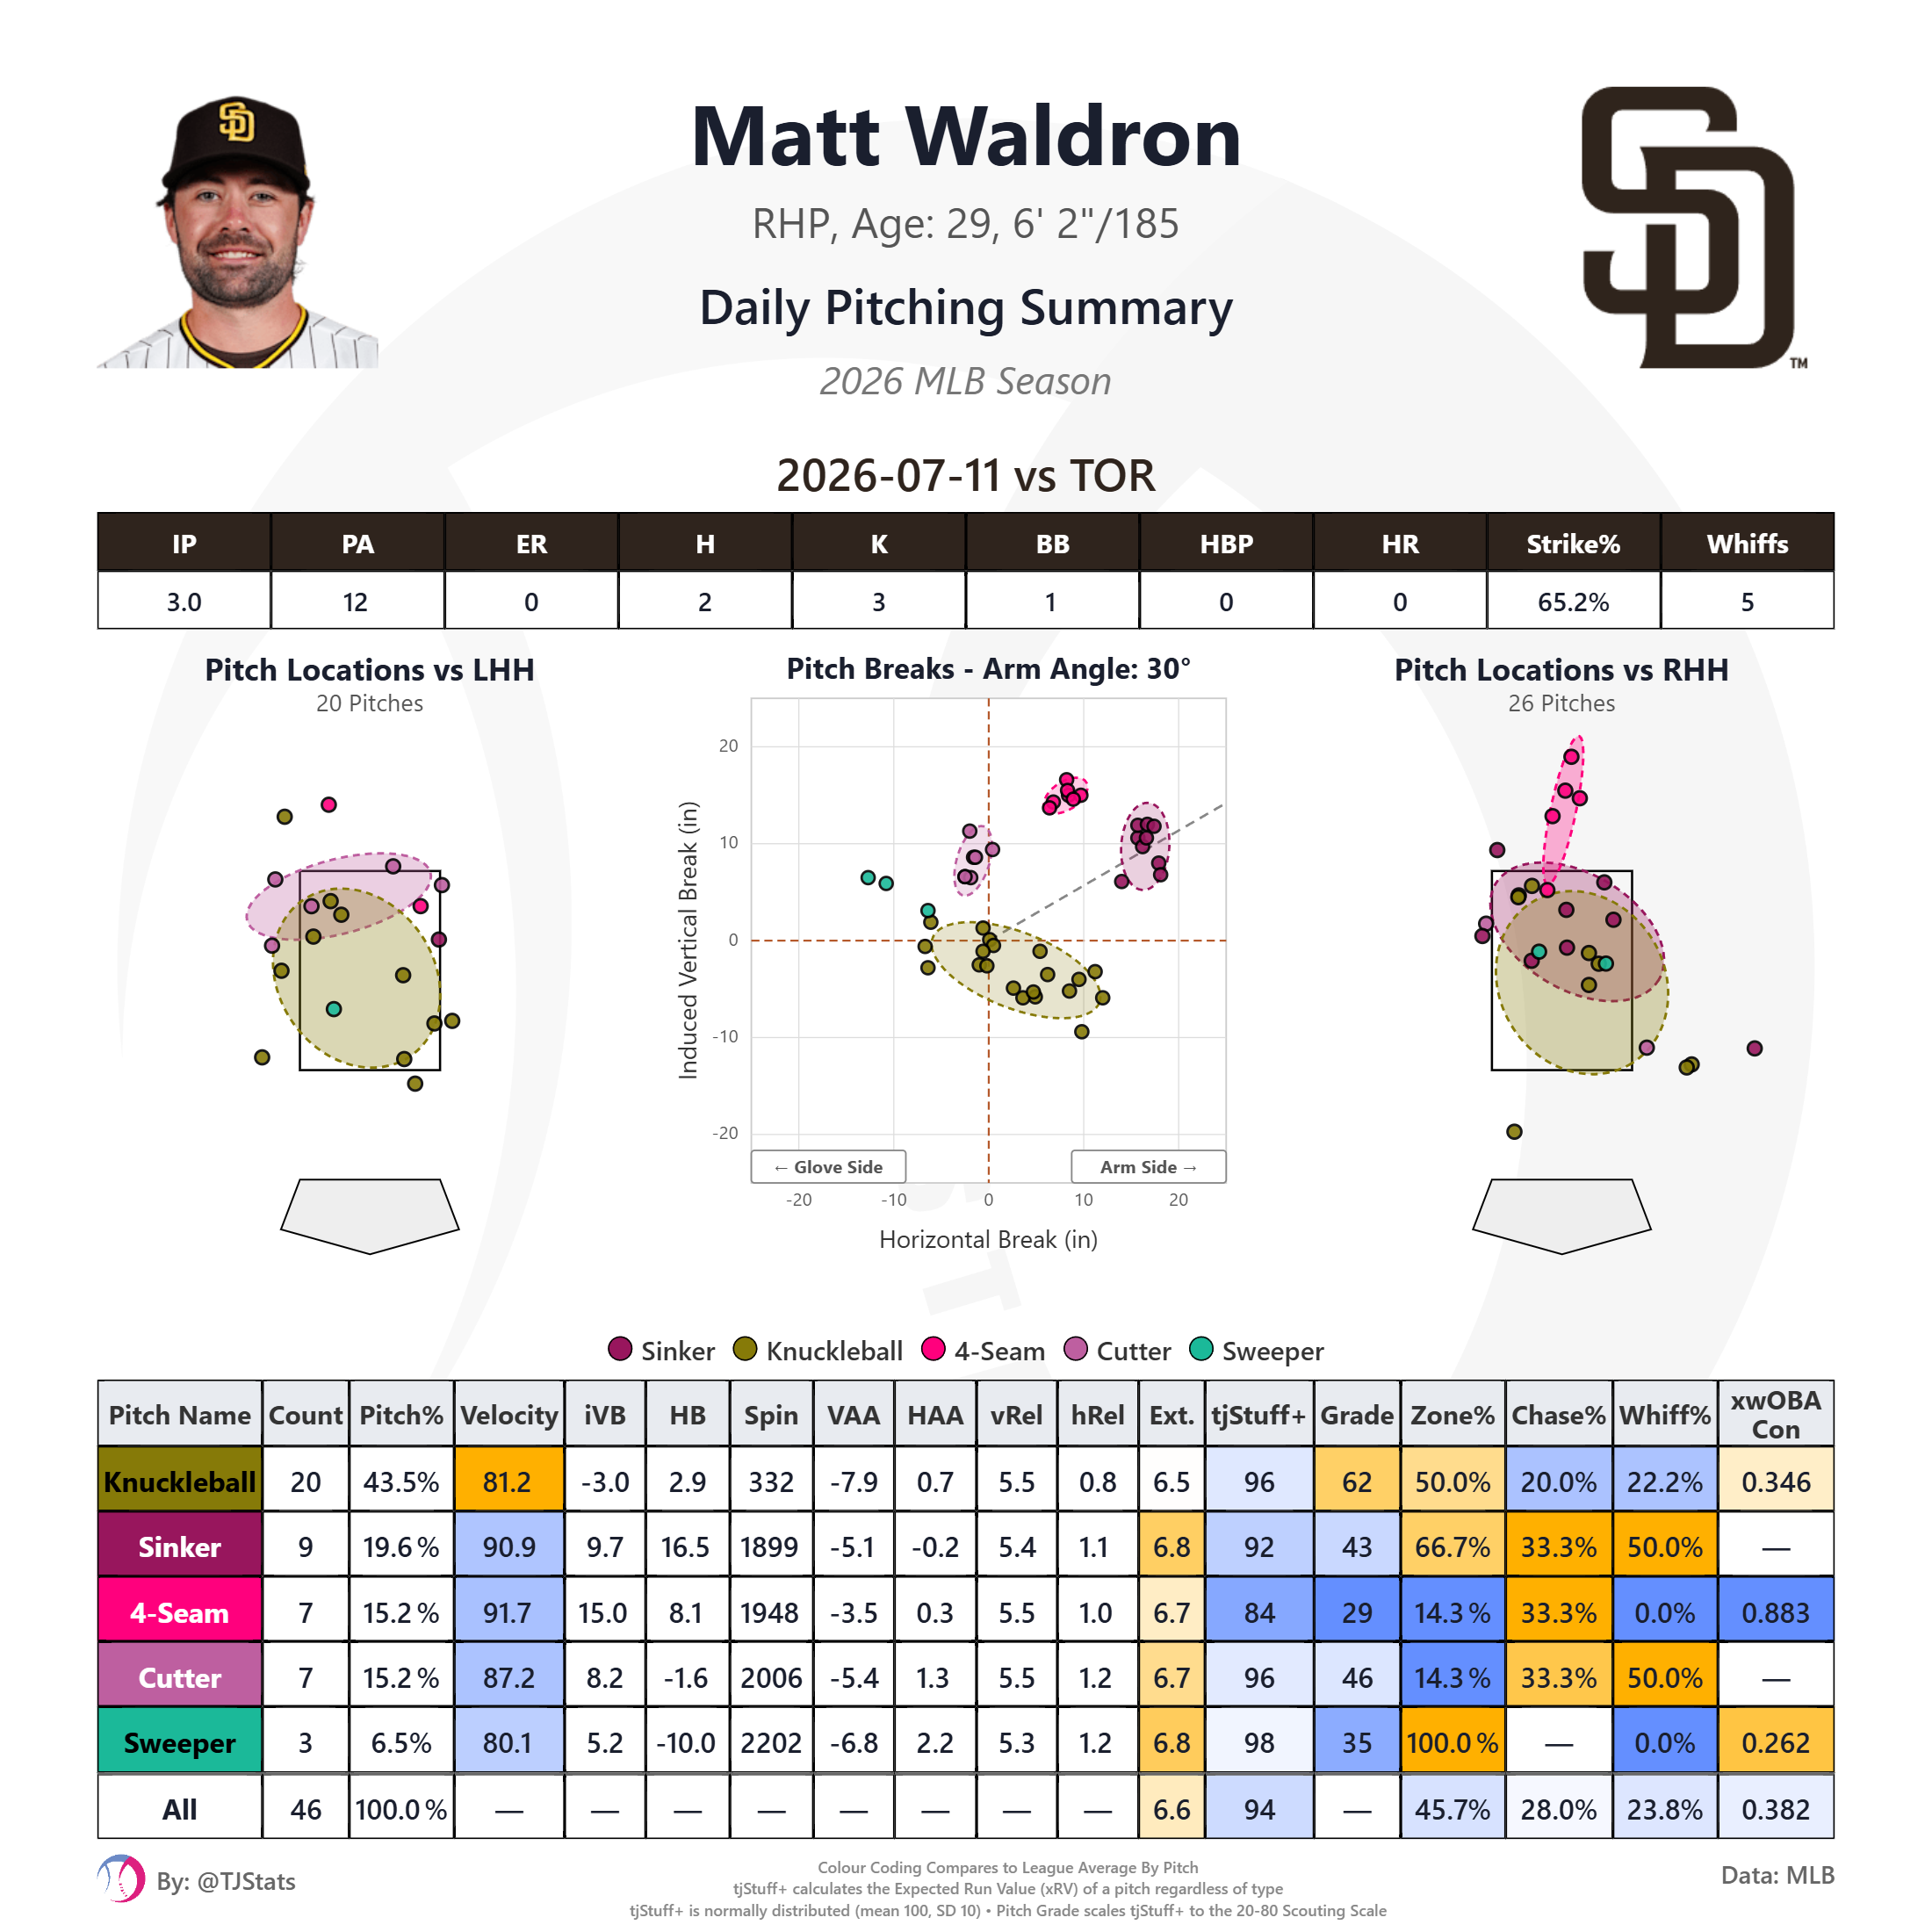
Waldron has a five pitch mix, but only one pitch that is likely to flummox opposing hitters with any regularity. And he’s been reluctant to throw the knuckleball as much as he probably should. But it’s not crazy to think that an opposing lineup seeing Waldron once, with a knuckleball-heavy approach, might have a hard time squaring him up right away.
Waldron’s track record and stuff suggest he’s not a credible multiple-times through-the-order starter. Waldron’s ceiling is as a floor raiser. A sometimes useful multi-inning reliever. Mucking up the timing of opposing hitters for a single look before the high-velo arms at the back of the bullpen can be brought in. That’s not a key cog in a deep playoff run, but it’s potentially a piece of the puzzle for limping in. Given the state of the rotation and bullpen, that is not a trivial discovery. If it’s real.
Canning’s Uncanny Luck
Canning deserves a more precise diagnosis than his ERA permits. He is a year out from the Achilles injury that ended his 2025 season with the Mets in which he’d pitched credibly as a number three starter.
In 2026 his stuff has been identical to 2025, and his arsenal has actually expanded with the addition of a sinker:
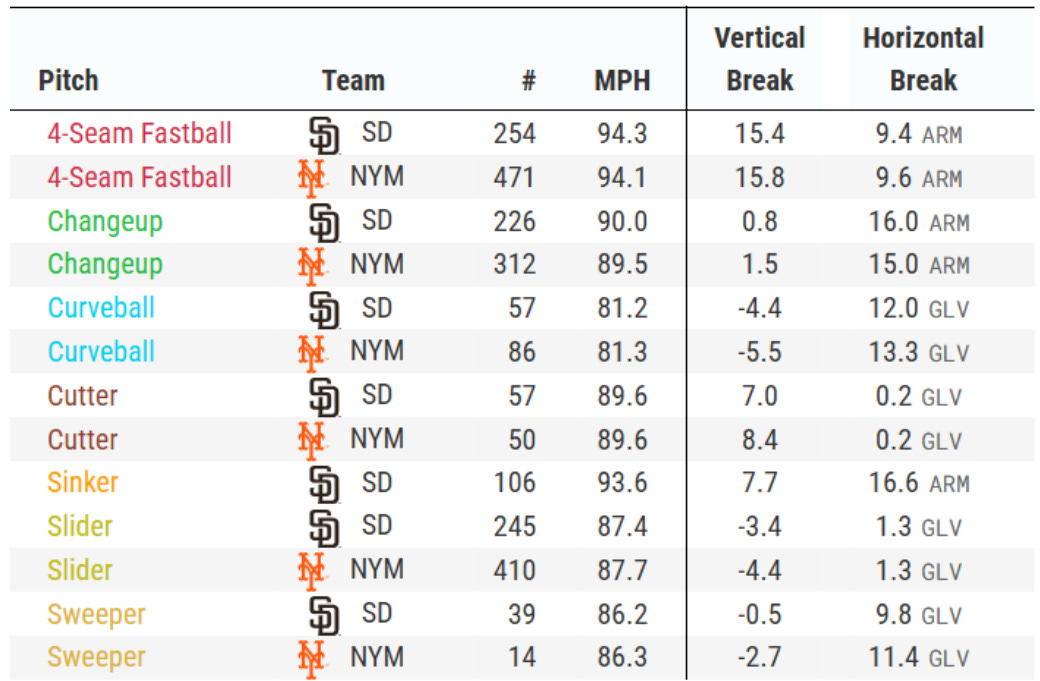
There are two factors that explain most, if not all, of the difference in on-field performance in 2026. Canning has never had the best control with a career BB/9 of 3.5. He pitched around this well enough to limit damage in 2025, but he’s walked batters more often, and allowed more total base traffic in 2026. He’s maintained his strikeout rate and his FIP is reflective of this. While it’s worse in 2026, it’s far lower than his 6.47 ERA:

His command struggles have come primarily from the inability to locate the changeup which is his second highest usage pitch after the four-seamer. He’s missed location with his sinker, but as a much lower usage pitch it hasn’t been the biggest source of his struggles:

The changeup is a very location dependent pitch and inability to locate it craters its effectiveness far more than stuff-dependent pitches. Unsurprisingly his changeup has produced terrible run value:
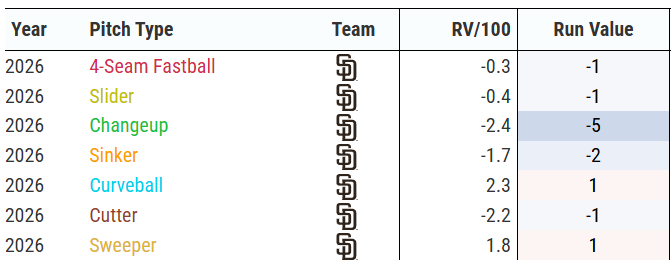
It’s not hard to believe that his command struggles could improve as he works all the way back to repeatable mechanics. It’s certainly not guaranteed. But there’s more to his horrendous first half than waning command.
There’s very good reason to think that Canning has had horrific sequencing luck. Here are his splits by base occupancy:
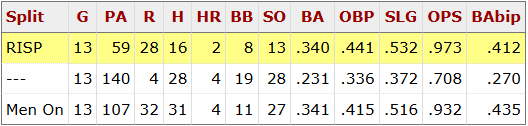
When there have been runners on base, opponents batting average on balls in play has been an unthinkable .435. With runners in scoring position opponents BABIP has been .412. It’s reasonable to think these are unsustainably high numbers that will regress positively to the mean. And not just because of how outlandishly high these numbers are. The underlying metrics suggest Canning has done a better job of foiling opposing hitters when runners are on base.
With the bases empty canning has allowed a hard hit rate of 49.5% with an average exit velocity of 91.2 MPH and an expected slugging of .421:

He’s probably gotten a little lucky in not allowing more damage in these at bats. But he’s actually held opposing hitters to a lower hard hit rate of 45.5% with runners on, and a lower expected slugging of .384, yet opposing hitters have slugged .516 with a BABIP of .435 in these at bats:

With runners in scoring position he’s held opposing hitters to an even lower hard hit rate at 38.9% and a similar expected slugging of .398, with a very good combination of low exit velocity at 88.4 MPH and low launch angle of 7 degrees. Yet opposing hitters have a BABIP of .412 in these at bats:

This is what bad sequencing luck looks like. 20% of the runs he allowed in the first half came from these six at bats:
With men on base, opponents hit the ball less hard. Their expected slugging percentage fell from .421 to .384. With runners in scoring position their average exit velocity and hard-hit rate fell further. But the on-field results moved in exactly the opposite direction. That shouldn’t continue, at least not at such an absurd frequency.
“Unlucky” is not the same as “Good.” Canning still walked far too many hitters, allowed too many home runs and had a 4.72 FIP in the first half. The contact data argue that the scandalous 6.47 starting ERA overstated how poorly he pitched. They do not argue that he pitched well.
Canning’s first half profiled as a passable 4th or 5th starter who clustered some bad outcomes that probably will be filtered out as his luck normalizes. Similar to Waldron, that’s a pitcher who can help a team secure a playoff berth, but does not confer an advantage in a short series against good teams.
Sunk Cost
Giolito’s struggles have a straightforward explanation: his stuff in 2026 has been nowhere near what he showed in his resurgent season for the Red Sox last year. In 2025 Giolito’s four-seam fastball averaged 93.3 MPH. In 2026 it averaged 90.8 MPH, regularly dipping into the high 80’s. That is simply not major league quality. And it raises the unanswerable question of whether the Padres knew his stuff had fallen so far when he was signed as Plan B. It’s hard to imagine that he would have received a contract had he performed that way in a showcase for the team. Perhaps he was signed sight-unseen? We’ll probably never know. Unless he miraculously comes off the IL able to find his prior fastball velocity, he likely won’t improve in on-field performance. That prospect seems about as likely as the return of Pivetta: Non-zero.
Giolito should not be counted on to find his 2025 form. But if somehow rest on the IL is sufficient to rehabilitate Giolito’s fastball, it should be straight forward to assess whether he’s ready by looking at the radar gun. If the fastball velocity isn’t there, there’s no reason to expect him to be any more effective. And there’s sunk-cost risk to playing him just because he’s under contract: Although his first half performance was only slightly below replacement player level, starting pitchers throwing high 80’s fastballs in the modern game are capable of performing significantly worse.
Plan A and B for the Pivetta Problem were immediate failures. Plan C is a work in progress. If Sears, Canning, and Waldron can pitch to slightly better than replacement level across the second half, they may do their part to help the Padres squeak into the postseason. They can probably do that. But it won’t be enough on its own. Other things also need to go right.
Dull Cutter, Sharp Decline
Randy Vásquez’s season can be divided neatly into two parts. Through May 15, he had a 2.68 ERA across nine outings, with 8.1 strikeouts and only 2.3 walks per nine innings. Over his next eight appearances, his ERA ballooned to 7.75, his strikeout rate was cut in half, and he allowed 10 home runs in 33⅔ innings.
The cutter sits at the center of that decline, although the problem is more complicated than simply saying Vásquez lost his command.
FanGraphs’ Location+ model evaluates the quality of a pitch’s location while accounting for pitch type and count. It does not know the catcher’s target, so it is not a literal measure of whether Vásquez hit his intended spot. Still, it provides a useful indication of whether he is consistently putting the cutter in locations that tend to produce favorable outcomes. Through May 15, Vásquez’s cutter carried a Location+ of approximately 99, essentially league average. From May 20 through his final start before landing on the injured list, that figure fell to roughly 94. The Location+ model confirms that Vásquez’s cutters were located in less favorable spots, but can’t tell us if that was because of poor execution, or poor location decisions. This is where the eye test comes in. Watch the repeated missed execution on locating the cutter to right handers:
These cutters were all meant to be outer-half chase pitches, and leaked over the inner half becoming meatballs.
Against lefties Vasquez repeatedly left the cutter down in the zone when his intent was to hit the top of the zone:
After May 15th his cutter Stuff+ declined by a nearly identical amount as the Location+, from approximately 99 to 94. And it’s interesting to look at why. Through his first nine starts the cutter averaged 89.9 MPH with 3.2 inches of glove side break (cut). Across his final eight starts the velocity increased to 91.1 MPH and the cut decreased to 1.6 inches. That’s a much different pitch shape.
We wrote about the most notable year-over-year change we saw in Vásquez’s early outings: his greatly improved fastball velocity. It’s fair to wonder if Vásquez recent struggles might be related to continuing to push the bounds of fastball velocity. Adding velocity to the four-seam and sinker almost always improve the pitch shape and effectiveness. The cutter is also a fastball, but it is very different from the other two, and is a very hard pitch to execute. The grip is very important, as the pitcher has to generate velocity while also using intense downward pressure on the side of the ball as he snaps his fingers down the outside of the ball at the release point and creates the spin that gives the cutter its cut:
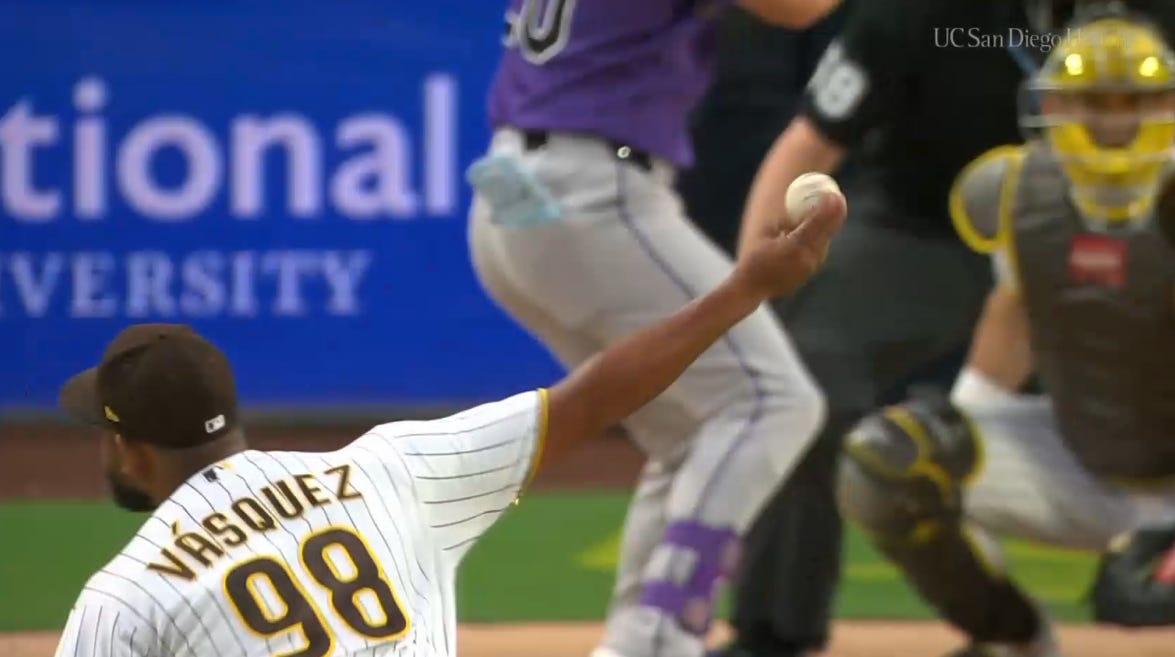
Here is the video of this perfectly executed cutter from April 9th against the Rockies:
In this game Vásquez threw 21 cutters averaging 89.7 MPH and a spin rate of 2826 RMP with 4.5 inches of cut. This particular cutter reached 2846 RPM and 5 inches of cut. You can see how delicate the shape of this pitch is. If the pitcher’s grip is too far behind the ball it will throw off the spin axis and the pitch shape will deteriorate even as the velocity incrementally increases from more of the arm’s momentum being transferred into the flight of the ball instead of rotation.
Since May 15th Vásquez’s cutter has been averaging 2684 RPM. He’s throwing the cutter hard, but losing spin and cutting action on the pitch. Throwing harder typically entails a tradeoff in fine motor control. This is stuff the Niebla pitching lab is undoubtedly working on as Vásquez readies to return to the rotation in the second half.
Vásquez was likely overperforming to some degree across his first nine starts when he was pitching like a number 2 starter, and at times like an ace. His true talent level lies somewhere between those dizzying heights and the below replacement level pitcher he became across his final eight appearances. It’s not out of the question he has a deep enough arsenal to credibly hold down the number 3 spot in a good rotation. Finding that form would move the needle for the Padres in both making the playoffs, and not getting steamrolled once they did.
Offensive Offense
The Padres offense had a horrid first half of the season. A series of unfortunate events cascaded across most of the first half, and reviewing them can add a better understanding of why the Padres have the league’s worst offense to date, and why it would be shocking if they ended the season performing as poorly.
The Stars Misalign
Early in the season the team’s two best hitters were replaced by imposters Manny Washado and Fernando Tatis Jr. Varsity. Thankfully they have since largely shed mechanical and timing issues and produced like the well above average hitters they are.
Tatis
Since the start of June Tatis’ swing length has shortened to 7.1 feet and he’s intercepting the ball at 31.3 inches from his center of mass on competitive swings, indicators of a much healthier swing path and timing combination. He’s slashed .291/.339/.449 across that span. That’s a lot closer to the all-star caliber hitter he’s expected to be.
The power is unquestionably still there:
Tatis’ issue has been with accessing that power. Being on time to the point of contact. Re-finding efficient swing mechanics. He still sits at only 5 home runs. But he’s made resounding progress.
Machado
Machado’s season is almost as strange as Tatis’. He entered July with a batting average below .190 and extremely flawed swing timing.
From March through June, Machado’s fastball swings had a 27.8 percent whiff rate and produced a competitive swing only 89.9 percent of the time. His swings missed their ideal contact point by an average of 0.8 inches. He made “perfect contact” on 23 percent of those swings, and had a flawed swing rate (meaning the swing was neither centered, lined up, nor on time) of 7%:

He was on record saying he’d made mechanical swing changes with a private hitting instructor and had recognized it was not working, and was actively trying to regain sound mechanics. There are many recent indicators he’s done just that. In the small July sample, the average miss distance on fastball swings fell to 0.4 inches. His perfect-contact rate rose to 41%, his whiff rate fell to 9.1 percent and every fastball swing graded as competitive. His flawed swing rate on these pitches dropped to 0:

It’s fair to question how much of the improvement can be attributed to Machado returning to the mechanics that had previously set him on a hall of fame trajectory, and how much is do to facing a normalized hitting environment. It’s almost certainly both. While it’s hard to quantify how much of the early season struggles were mechanically related, it’s not hard to quantify how adverse the hitting environment Machado languished through in the first half was. Mike Petriello summarized it thusly:

In July Machado has slashed .308/.413/.564 and has three home runs in 39 at bats. Twenty-two July fastball swings are not sufficient to declare his slump dead. But they are sufficient to show that the improved July results were accompanied by a measurable change in process.
Merrill
While Tatis and Machado have provided convincing evidence that better things are in store, Jackson Merrill still appears lost at sea. Merrill has always been a bit of a free swinger, and when he struggles its intuitive to assign a lot of the blame to this tendency getting worse. But that doesn’t seem to be what’s really ailing Merrill. Swing decisions and swing execution are related, but they are -not- the same thing. The Swing/Take profile allows us to separate the decision from what the swing ultimately produced. And the most revealing insight comes from looking at Merrill’s performance on pitches in the heart of the zone. The very best pitches to hit.
In 2025, Merrill generated +12 runs of value when he swung at pitches in the heart of the zone. Taking those pitches cost him four runs, leaving him with a net value of plus-eight. In 2026, the value of taking those pitches remained exactly the same: minus-four runs. The value of swinging at them fell from +12 to minus-eight, producing a net value of minus-12.
That is a 20-run reversal on the most hittable pitches. Those are the pitches a hitter is supposed to attack.
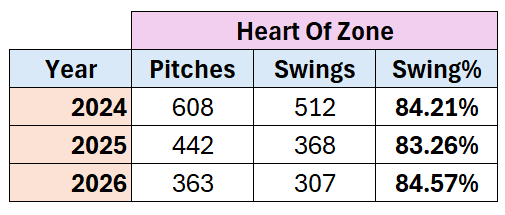
Merrill swung at 83.26% of heart-zone pitches in 2025 and 84.57% in 2026, well above the league average in both seasons. He continued making the correct swing decision. But in 2026 the swing stopped producing the expected result. And some of that is almost certainly rooted in approach changes he’s made.
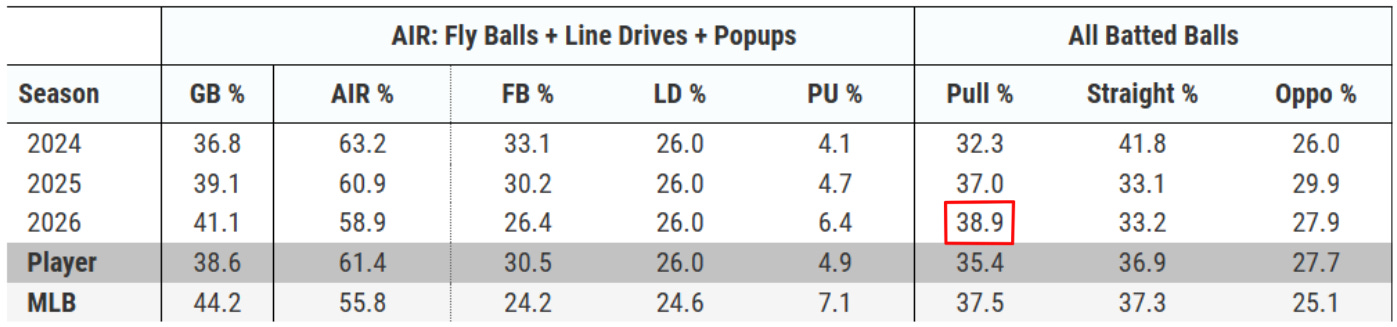
Examining his batted ball profile shows that in 2026 he’s been a very different hitter from his rookie season. His pull% is noticeably higher:
And his pulled air% is a top 6% mark in the league:
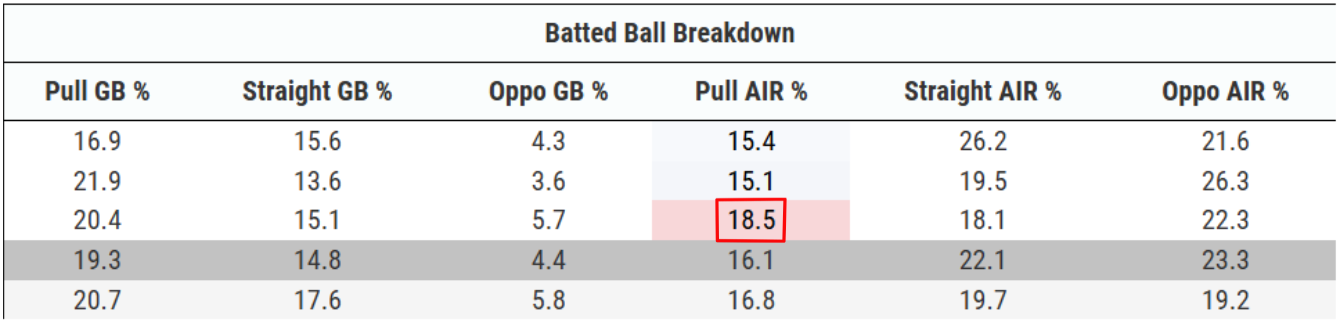
Pulling the ball, especially pulling it in the air, has been an obsession of metric focused analysts because both measures correlate with hitting home runs in linear regression testing. Merrill has achieved an objectively elite pulled air % in 2026 but is slugging .350 and is on track to have his worst season at the plate.
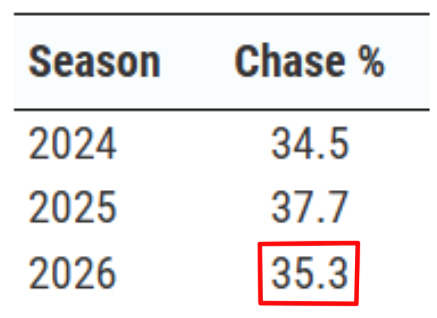
There’s an adage called Goodhart’s law that states: when a measure becomes a target, people optimize for the metric rather than the underlying goal, making the metric less reliable. We can’t help but wonder whether Merrill has made approach changes based on the fashionable analytic dogma and optimized around pulling the ball in the air, and unintentionally disrupted his ability to make consistent flush contact in the process. A player’s approach at the plate is very hard to glean. Only he really knows what’s going on in his mind. But the change in batted ball profile is large enough to not seem random. And we can essentially rule out performance deterioration due to chasing more bad pitches. His chase rate is down year-over-year:
We can rule out being too passive, his swing% on pitches in the heart of the zone is the highest of his career:
Clues that it’s his ability to make flush contact emerge when we look a little closer. In 2026 when Merrill swings at pitches in the heart of the zone, he’s putting it in play at by far a career low rate. And that’s not due to swinging and missing, his whiff% in the heart of the zone is 15.31% in 2026, down from 16.39% a season ago. It’s because he’s fouling off almost 50% of the best pitches to hit, far above any prior season. Only 35.8% of the pitches he’s swung at in the heart of the zone have been put in play:
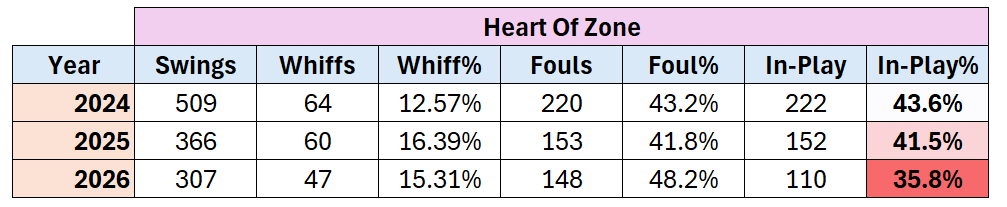
To think about it another way, compared to his rookie season, he’s putting 7.8% fewer balls in play when he swings at pitches in the heart of the zone. He’s swung at 307 pitches in the heart of the zone in 2026. That translates to ~24 swings (307 * 0.078 = 23.9) where instead of a ball put in play, Merrill simply incurs a foul ball.
In 2026 MLB hitters have an OPS of 1.372 on 3-1 counts. When the count goes to 3-2 that drops by 600 points:
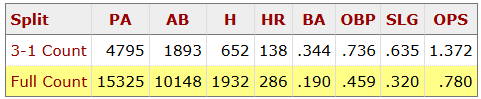
When a player gets a pitch in the heart of the zone on 3-1 the disparity grows even wider. Foul ball rate is an almost entirely neglected facet of baseball analytics, but it shouldn’t be. Because it can indicate when a player is struggling to make flush contact even when he’s making good swing decisions. And we now have tools to dig a little further using Statcast’s bat tracking.
Bat tracking shows that Merrill’s bat path is indeed missing by farther than year’s past:
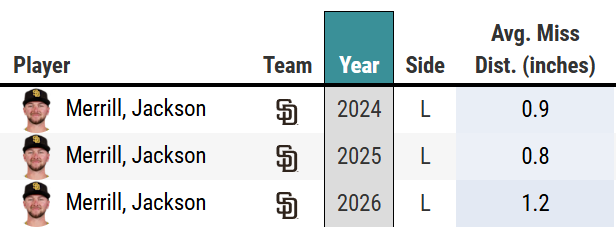
We can infer that this is due to a loss of precision in barrel control in some aspect of his swing mechanics or swing timing.
We can see that Merrill’s overall flawed swing % is stable, but his perfect contact % has dropped a bit from last season, confirming a loss of precision somewhere in the swing:
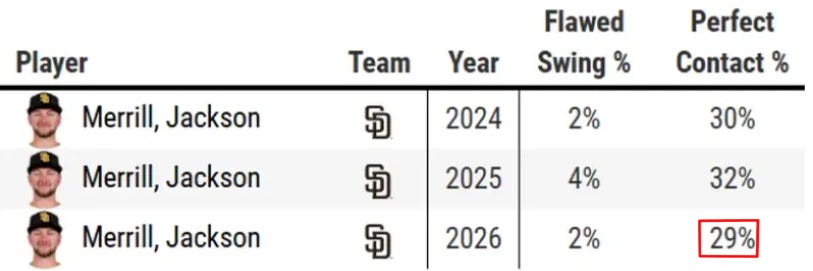
It doesn’t look like it’s a swing timing issue as Merrill’s On Time swing rate is at an all time high of 77%, but we can see that there is a very clear trend within his swing timing in 2026:
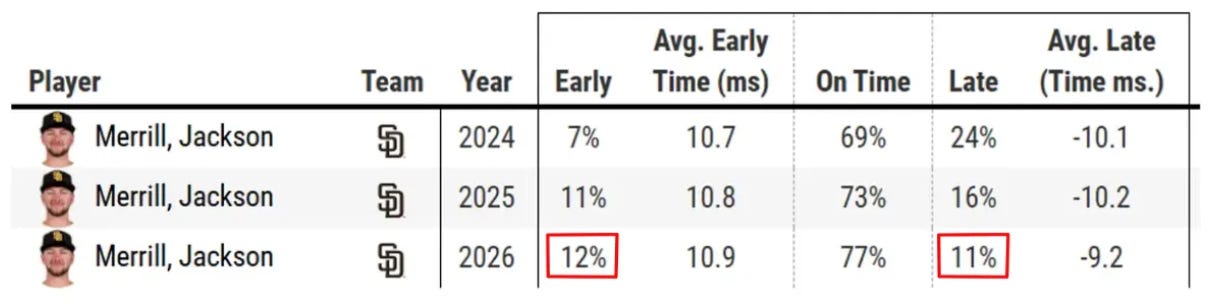
He’s early to point of contact more often, and late to the point of contact far less, than in year’s past. This is as close to a smoking gun as it gets when assessing whether a player has adopted a pull heavy approach.
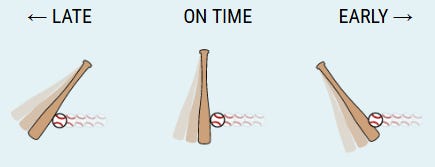
Merrill has been on time to the point of contact 77% of the time in 2026, and that is an improvement over years prior. But contact that is early or late can still become good contact if the barrel is lined up with the ball:
And this is where Merrill’s struggles are primarily coming from. His ability to line up the barrel with the ball when he gets a good pitch to hit:
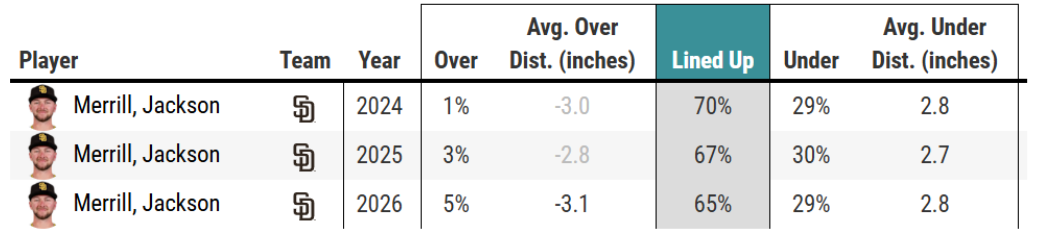
He’s struggling to make flush contact in the vertical plane more frequently than in the past, with a career worst 65% of his swings lined up. He’s swinging under the ball at a stable rate year over year, but 5% of his swings have been poorly lined up over the ball in 2026:
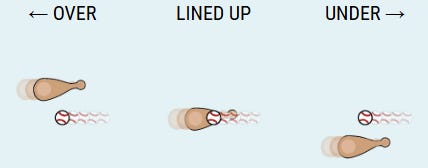
Only 65% of his swings on pitches in the heart of the zone lined up in the vertical plane, the lowest percentage of his career.
He’s been timed up, but not lined up, with far more frequency than in year’s past, and that why even in hitters’ counts on pitches in the heart of the zone, he’s frequently failed to turn the swing into damage:
Merrill’s Swing is measurably different in 2026, with career high bat speed, but his swing tilt axis has also been steeper:
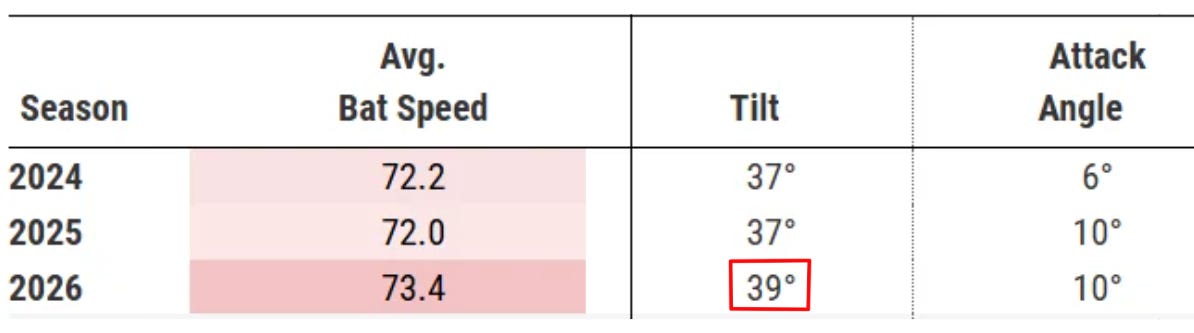
This does not prove which part of the swing malfunctioned, just that it is shaped differently. You can speculate that a more violent swing could lead to a tradeoff in fine motor control and incremental loss of barrel precision. That a pull-conscious approach can subtly alter the geometry of the swing, changing where and how consistently the barrel meets the ball. Round after round of trading a ball in play for a foul ball may have led to deterioration of Merrill’s production through negative count leverage. You can speculate, but you can’t know. Only he can.
Merrill’s .219/.278/.350 line in the first half was good for a 76 wRC+. 24% below league average. Merrill is a much better hitter than this. Something has gone wrong. It seems to be a different issue than what either Tatis or Machado struggled with. But of the three, Merrill is at the most malleable stage of his developmental arc.
Ironically his strongest tool as a prospect was preternatural, instinctive, contact hitting. This is what allowed him to be a productive hitter despite never commanding the strike zone like Juan Soto does. And it’s the tool that’s abandoned him. Or vice versa. Merrill has the strongest likelihood of the three to return to the peak performance of his career. Over the long run. It’s highly uncertain that, even if he can pinpoint the problems in his approach and mechanics, he will find that form across the short window of the second half.
Godspeed Jackson.
The Padres do not need Machado and Tatis to become MVP candidates. But they do need both hitters to sustain above average offense across the second half. A 90 wRC+ offense doesn’t have the juice to carry three stars performing between league average and 24 percent below average. There are not enough Ty France sacrifice flies in the world. Thankfully, there are a few other sources of likely improvement across the rest of the season, primarily unwinding the domino effect.
Domino Effect
Luis Campusano was one of the few Padres who appeared capable of changing the offense when all three of its star players were deep in the suck. In 81 plate appearances, Campusano hit .300/.395/.571 with four home runs and a 168 wRC+. Then he fractured his left big toe after fouling a ball off his foot and went on the injured list on May 7. Since his return on July 4th he’s slashed .333/.478/.500 with a home run in 23 plate appearances.
His absence might have been manageable if Freddy Fermin had remained an ordinary version of Freddy Fermin. Instead, Fermin finished the half hitting .152/.252/.268, a 51 wRC+. Fermin repeatedly absorbed foul tips, including two shots off his mask in the same game in April. He entered the concussion protocol in June, returned, and subsequently went back on the injured list with a head contusion. We can’t know exactly when those blows began affecting his hitting. His offensive problems preceded the formal concussion diagnosis, so this is not a clean before-and-after split. But concussions are notoriously a clinical diagnosis dependent entirely on subjective symptom reporting from the player. It is reasonable to think that repeated head trauma has explanatory power.
Campusano’s return improves the second-half lineup, but it also clarifies how painful his absence was. The swing in OPS between the two players is ~.400, about the same gap between Aaron Judge and Rodolfo Duran. The Padres did not merely replace an excellent hitter with a weak one. They leaned heavily on a catcher whose apparent loss of skill was seen on both sides of the ball.
Outfield Opportunity Cost
Ramón Laureano’s season followed a different but related arc.
He opened the year as one of the hitters allowing the Padres to survive the slumps of their stars. In mid-April, Laureano was hitting .292 with a .921 OPS. He supplied power and credible corner-outfield defense.
Then his production collapsed. By the time he went on the injured list, his line had fallen to .203/.286/.374, a .660 OPS. He struck out in 31.6 percent of his plate appearances and finished with an 86 wRC+.
In real time, the falloff was difficult to explain. It is less mysterious now. Laureano had surgery on June 5 to repair a torn labrum in his right hip. The problem reportedly dated to 2021 and worsened during the Padres’ late-May trip to Washington. With an expected recovery of four to five months, the surgery will almost certainly end his regular season.
His absence mattered even after his bat stopped producing because it narrowed the defensive choices available elsewhere. Nick Castellanos is nearly unplayable in the field, but he became one of the outfield options when Laureano was lost.
A subsequent injury would put further leverage on the lack of outfield depth. Jake Cronenworth was struck in the jaw by a 97 mph fastball on April 18. He initially passed the concussion protocol and continued playing, but his eyes were no longer working together properly. He went 4-for-31 after the injury, fell to .144 and finally went on the injured list on May 5. He did not return until June 29.
When Cronenworth was lost, the Padres were not yet prepared to trust Sung-Mun Song as an everyday second baseman. Instead, Fernando Tatis Jr. moved to second base for a long stretch to cover Cronenworth’s absence. This incurred the outfield opportunity cost where Tatis is the reigning platinum glove award winner.
Tatis made 39 starts and played 331 innings at second base. He was playable at the position. That was never the question. The question was what the move did to the rest of the defense. Moving Tatis to second base converts right field from an elite defensive position into a liability. The Padres gave substantial corner-outfield time to Gavin Sheets, who has improved his game quite a bit:
But Sheets is not a plus defender. Bryce Johnson and Jase Bowen played adequate defense, but both were negative forces at the plate and dragged the floundering offense downward. Before his release Nick Castellanos amassed minus-4 outs above average in ~180 innings in the field, a breathtaking minus-32 pace across a full season. Samad Taylor finally emerged as a passable bat and defender for a few weeks before he too was injured.
The Domino effect on both offense and defense was profound.
But it’s finally, mostly, unwinding.
Cronenworth’s return and a greater willingness to play Song should allow Tatis to spend more time in right field. That should restore some of the run prevention lost in the chain reaction. Having Campusano and Cronenworth back in the lineup with a resurgent Machado and Tatis should push the offense back into league average, or better, territory across the second half. If Merrill can find True North, the offense might be dangerous…
The Dog Days Of June
The bullpen was the best functioning part of the first-half roster. It finished with a 3.68 ERA and 4.6 WAR. Mason Miller had a 0.91 ERA, a 0.53 FIP, a 48.3 percent strikeout rate and converted all 25 save opportunities. Adrian Morejon combined a 64 percent ground-ball rate with a 2.40 FIP. Bradgley Rodriguez emerged as a credible major league reliever.
That group is the primary reason a team with a minus-43 run differential reached the break at .500.
It is also diminished.
Jason Adam went on the injured list July 3 with a right shoulder strain. Although his 2.51 ERA looked familiar, his strikeout rate had fallen to 16.4 percent and his FIP had risen to 4.68. He had already posted a 5.11 ERA in June before the shoulder problem emerged.
Jeremiah Estrada had already missed time with elbow tendinitis and returned without his usual velocity. He later went back on the IL with knee inflammation and appeared only 21 times in the half. His first absence followed a decline from a 97.9 mph average fastball in 2025 to 95 mph early this season.
The bullpen can remain above average without Adam and Estrada. Miller and Morejon are elite. Rodriguez, Wandy Peralta and Yuki Matsui have supplied useful innings. Waldron may add length in his new role.
The more important question is whether it can remain above average while compensating for the rotation.
A reliever’s absence does not remove only his innings. It changes everyone else’s innings. Miller can record four outs occasionally, but using him before the 9th makes the 9th somebody else’s problem. Morejon can escape a seventh-inning crisis, but then he is unavailable when tomorrow’s starter reaches 90 pitches in the fourth. Middle relievers become setup men. The least trustworthy arm becomes unavoidable in every extra-inning game.
The bullpen should still be a strength in the second half. It should not be expected to continue concealing the rotation at the same level without either better starting innings or reinforcements.
Competitive Environment
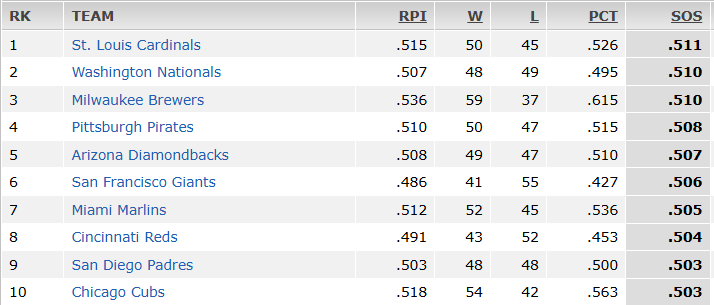
The second half starts Friday against the Kansas City Royals. The Padres should have a more favorable competitive environment in the second half. The Padres first half strength of schedule was one of the tougher in the league:
Their second half strength of schedule projects to be the 4th easiest in baseball according to Fangraphs:
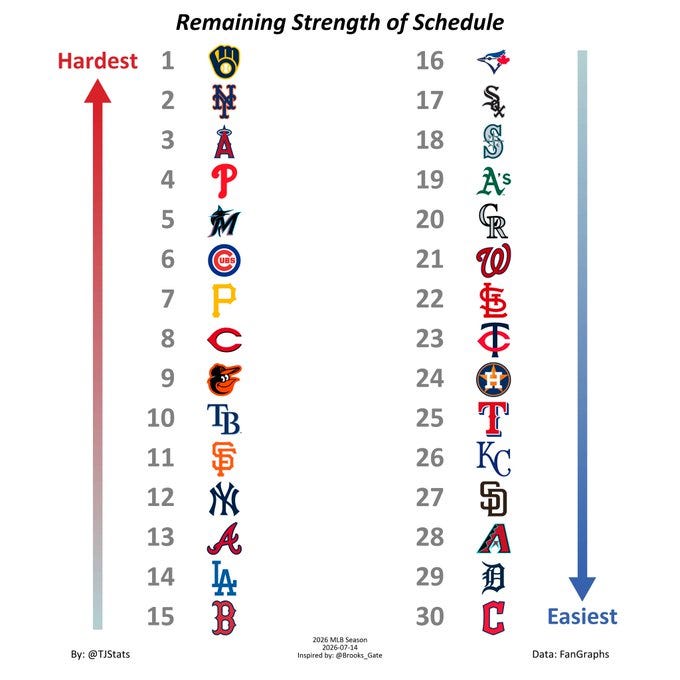
But this only translates to an opponent strength of schedule of .493. If the Padres true talent level is a .500 team, it won’t matter how easy their schedule is, they won’t make the pace to reach 87 wins by season’s end. If they’re closer to their pythagorean 43-53, it’s all the more bleak.
Is this 2024 again?
The comparison is irresistible. The 2024 Padres entered the All-Star break at 50-49, lost their first game afterward to fall to 50-50 and then played the best second-half baseball in the sport. They went 43-20 after the break and finished 93-69.
The similarity is real at the level of record only. Both teams reached July near .500. Both had endured significant injuries. Both possessed stars capable of changing the offense quickly. Both retained a front office willing to remodel the roster aggressively. The 2024 team demonstrated that mediocrity at the break is not a sentence.
But precedent is not projection.
The 2024 Padres had a better offensive foundation. The lineup featured major league hitters 1-9, including a triumphant rookie campaign from Jackson Merrill. Machado was moving toward a strong finish. Dylan Cease and Michael King supplied top-of-the-rotation innings. Joe Musgrove eventually returned. At the deadline, the Padres added Jason Adam, Tanner Scott and Martín Pérez to a roster whose underlying performance already suggested a contender.
The 2026 Padres have a 90 wRC+, a minus-43 run differential, a rotation vacancy that became several vacancies and a 12 percent playoff probability. Laureano is effectively gone for the season. Campusano and Cronenworth have returned, but Pivetta’s timetable remains uncertain. Adam and Estrada may return, but neither entered the break as a fully stable version of himself. Merrill is still lost at sea. Machado and Tatis are surging, but doubts still remain if either is truly ‘all the way back’.
There is narrative similarity to 2024. There is structural dissimilarity.
There is still a path. Machado’s timing improvement may be real. Tatis and Merrill could find peak form. Campusano restores an actual offensive threat at catcher. Cronenworth’s return can move Tatis back to right and improve the defense in two places. Canning’s bases-occupied results should not remain that extreme. Waldron may be more useful in relief. Adam and Estrada may heal. Pivetta may return. Preller may find another starter.
None of those propositions is absurd. The problem is how many variant outcomes must become true at once. And when so many outcomes have to go your way, even if each is individually likely, the probabilities compound that enough will go wrong to sink a longshot season.
That is the framing to take into the 2026 trade deadline.
Raising The Waterline
A central question across the critical next few weeks is whether the Padres’ ambitions have graduated beyond the ‘just happy to make the playoffs’ paradigm. That was undoubtedly the measure of a successful season for most of the Padres existence. Our entire lives really. But it feels like the waterline has been raised. Peter Seidler’s long term goal was a championship parade. In the short term, we were happy to limp into the playoffs. That doesn’t sound so satisfying now. And maximizing the chance to do so one more time in the present is in tension with the ambitions of the future.
A sober look at the 2026 Padres first half performance, and second half prospectus, illustrates a team with more questions than can possibly be answered across the next three weeks. AJ Preller will go into the trade deadline with irreconcilable uncertainty. And this demands a consideration of both sides of the ledger. There is considerable opportunity cost for buying at the deadline. And Preller seemed to indicate selling is now at least under consideration:
“We’re going to go into the process open-minded to see what’s there and see what can help our club,” Preller said. “We’re going to go in open-minded about whether it’s acquiring players or looking at it if we have to go another direction. All those things are on the table.”
The approach we would take is one of deep skepticism that a true contender will emerge from the chaotic 2026 first half. Not that it’s impossible. Just that it is unlikely. And we would manage present and future risk with that in mind. Buying at the deadline should carry a prerequisite: the value must blow you away. There’s no world in which Preller could acquire Tarik Skubal and Sandy Alcantara while preserving the blue chip prospects. But if there were, that would be a time to buy. If there are diamonds in the rough toiling in obscurity for an overlooked team with an overmatched GM that could provide similar value, that would be a time to buy. And that’s it. This is not the season to spend down the balance of blue chip capital for one last tilt at the windmill.
To believe this is the year to push all in is to believe without evidence. Faith is not a statistical forecast; it is an emotional commitment. Our hope is for a sober, disciplined trade deadline. But if we're wrong, if the believers are vindicated and this group proves stronger than the evidence suggests, nothing would make us happier.
Go Padres.
The concept of a replacement player assumes that teams can draw from an abundant pool of readily available minor-league or fringe major-league talent to replace an injured starter without production falling below a predictable baseline.
Great analysis. I am buoyed by Padres offense since the final week of June is 3rd in wRC+ and fWAR. Not sure how sustainable but solid. Meanwhile, starting pitching has been absolutely horrible. Expecting much from Pivetta and Musgrove is probably a fool's errand but also seems like the sole path to the playoffs. In terms of selling/buying, it seems like immediate future of Padres' teams has a downward slope. The only thing I see arresting that are unexpected/lucky good play or bloating the spending even higher with FA signings. So, if that view is shared by decision makers, this may be the very last year to squeeze a playoff spot for a bit, so think they will try to buy. Salas seems like the only asset that can sell and unambiguously make the team better. Trading Miller requires netting the new value less his value. So maybe Salas for a good starter might do it, coupled with decent production from Pivetta and Musgrove. They need three good starters to do anything in the playoffs even they somehow get there.
Phenomenal stuff as always. A longread like this really made up for the wait since your last one 😜