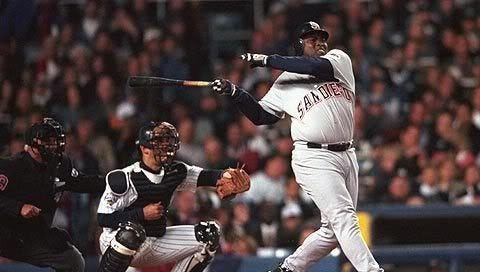
Cover Photo Courtesy: FriarWire
The All-Star break is the true halfway point of the season, and this was the most confusing first half of baseball we can ever remember. Are the Padres good or bad? There’s so much mixed evidence that you can craft whatever narrative you want: They are overpaid and underachieving. Plausible. They are playing hurt and their record doesn’t reflect who they are. Plausible. They’re very good but very unlucky. Plausible. They just suck… that’s the one narrative that bears the most scrutiny. So let’s scrutinize.
They just suck: The evidence
The most compelling bit of evidence for this theory is their record: The Padres are 43-47, 6 games back of the Wild Card. This is the ‘You are what your record says you are’ line of reasoning. Whether you buy this logic or not, it’s always relevant on the last day of the season: Who advances to the playoffs and who advances to an extended vacation in Cancun is determined by record. People use this phrase to signal that no excuses will be accepted. But it’s easy to conflate excuses and explanations. Excuses gloss over flawed processes, but explanations can shed light on whether or not a process is broken. Until the season’s over, there may be more to a team than just its record, so let’s look under the hood and see if we can figure out what, exactly, is behind the disappointing first half.
Relevant Facts
The Padres have the third best run differential in the NL at +39. That gives them a Pythagorean winning percentage expectation of 0.551, which works out to a 50-40 record. They have the second-best team ERA in the NL at 3.78. They have allowed the second fewest runs in the NL at 362. They have a nearly league average OPS at .726. They have the 6th worst runs scored in the NL at 401.
We can break down these findings further: The bad performance in runs scored is almost entirely explained by atrocious hitting in clutch situations. For much of the year, the Padres were the worst hitting team with RISP in MLB history. And though the Padres have heated up just enough to no longer be the all-time worst hitting team with RISP (suck it, 1899 Cleveland Spiders!),they’re still the worst in MLB this season, behind even the Oakland AAA’s.
The Padres’ RISP struggles are even bleaker when you start to look at their at bats with RISP in high leverage situations. Baseball Reference keeps a list of “Clutch” stats, including “ Late and Close” plate appearances, which are defined as being “in the 7th or later with the batting team tied, ahead by one, or the tying run at least on deck.” These are high-leverage at-bats, where the effects of the outcome are magnified. And this is where we find more explanation for the Padres’ lousy season:
This is where the Padres have failed to live up to their potential across the first half of the season. The futility is incredible. Mythmaking stuff. You also might notice that this stat is the secret sauce explaining the Diamondbacks’ success; they’ve had elite hitting in late and close situations. This is also how the Marlins have stretched their measly run totals to a staggering number of wins. There is more leverage on the runs they’ve scored. The Marlins and Diamondbacks have been good while the Padres have been bad because the Marlins and Diamondbacks are extremely clutch and the Padres are extremely not. You see the fallout of this specific failure in the Padres extraordinary 0-8 record in extra innings, and the ghastly 5-15 record in one run games. The Padres are the definition of “not clutch”.
But that’s just luck right?
There are two primary schools of thought about clutch hitting. The first is that it’s a real skill. Some players buckle under the pressure, while others rise to the occasion. There is not much statistical evidence that this is true, but it’s what some people believe.
The second school of thought about clutch hitting is that it’s just luck, and players’ outcomes in clutch situations trend with their baseline skill. There is so much exploration of this question that it’s really astonishing that there is no consensus. Still, the “skill vs. luck” question is extremely relevant to the Padres’ prospects for the second half of the season. So, let’s try to determine if the Padres are unskillful or unlucky by looking at how they score runs.
Three True Outcomes
The Padres method is built around the three true outcomes (TTO) approach to hitting, which has been widely-accepted as a run maximizing strategy. The three true outcomes are strikeouts, walks, and home runs. They’re called the “three true outcomes” because they don’t involve any luck around what happens when a ball is put in play, because none of these results in a ball in play.
The three true outcomes approach to hitting was first articulated by Ted Williams in his book “The Science of Hitting”. It’s also been described well by Mario DeGenz:
TTO-heavy hitters generally tend to follow one basic plan of attack at the plate: wait for a specific pitch you think you can hit 450 feet, take the pitches you can’t put a good swing on, and whenever you do get a pitch you can handle, swing hard.
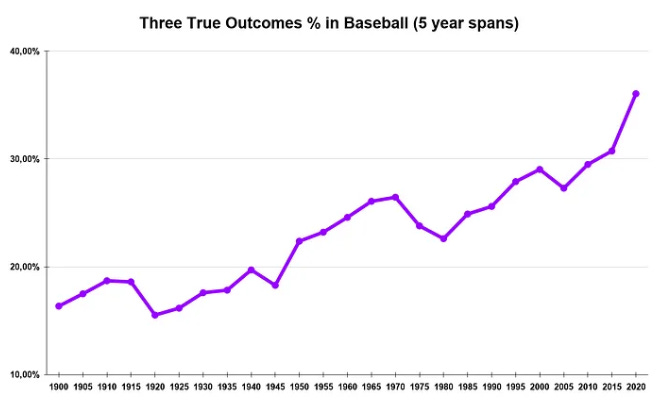
The inner workings of the TTO approach are based on the observation that a walk is nearly as good as a hit. A home run is much better than a single. And strikeouts are an acceptable tradeoff for more total runs scored. The TTO approach became more popular as Statcast provided a groundswell of data, pitch velocities increased, and more teams adopted the shift. The trendlines are quite staggering:

Padres, TTO Enthusiasts
The Padres are fourth in MLB in pitches seen per plate appearance. They are second in MLB in strikes looking %. And they are dead last in MLB in percentage of pitches swung at. They lead the MLB in walks.
This is the profile of a team hunting TTO run maximization. They see tons of pitches, including watching strikes go by, and rarely swing. They lead the major leagues in walks. When they do swing it looks like this:
Courtesy @KaplanandKrew
That was with 2 strikes. This is the apotheosis of the TTO approach; try to hit home runs even in an 0-2 count facing a 95 MPH fastball.
More evidence: Five Padres are in the top 50 in taking strikes looking: Juan Soto (1st), Ha-Seong Kim (3rd), Xander Bogaerts (14th), Trent Grisham (47th), and Jake Cronenworth (48th). This is an organization systematically coaching its players to adopt the TTO style of hitting1.
The Third Clutch Theory
We said before there are two primary schools of thought around clutch hitting: it’s a real skill that some players have and others don’t that statistical analysis just hasn’t been able to identify yet. Or it’s a mirage, it’s just situational luck destined to have a few outliers coronated clutch lords. But there’s a third obscure theory about clutch hitting, one that posits ‘Clutch’ is not a skill but a byproduct of a particular style of hitting. That is: Some guys are clutch and some guys aren’t, but it’s not because they have ice water in their veins or butterflies in their tummy. It has to do with whether they’re a TTO type of hitter.
The evidence for this theory comes from Fangraphs’ identification of clutch hitting. The Fangraphs formula compares a hitter’s performance, in terms of win probability added (WPA) in high-leverage situations (i.e late in the game, close score, men on base), to that same hitter’s performance in context neutral situations. And there seems to be a direct connection to how much a hitter follows the TTO approach.
In late game, close score, men on base situations the theory argues:
1) strikeouts, which are always bad, are even worse than usual; 2) walks, which are usually good, are sometimes worse than a “productive out”; and 3) ball-in-play situations that are bad in a context-neutral sense, like deep flyouts, ground balls deep in the hole, and errors, often produce game-changing runs. (Home runs, of course, are even better in a high-leverage situations than they are under normal circumstances, but they’re always the least likely of the three true outcomes.) High-leverage situations reward putting the ball in play, even weakly, and harshly punish walks and strikeouts.
The argument is that the TTO approach is not great in certain high-leverage situations. In those situations, the optimal approach may be to minimize strikeouts, downplay walks, and prioritize contact, even if that means less chance of hitting a home run.
The best place place to search for evidence of clutch performance might be Fangraphs’ all time clutch leaderboard (because other data sets tend to suffer from small sample size). This list contains players who have had thousands high-leverage ABs. If it’s correct that TTO players tend to be not-clutch, then we’d expect to see guys with outstanding bat-to-ball skills at the top of Fangraphs’ list. Take a look at who sits atop the Fangraphs all time clutch leaderboard:
The best clutch hitters of all time are prodigious singles hitters, high-contact players who neither walked nor struck out much. And also Dave Parker, for some reason (maybe because he has an unusually low strikeout rate for a slugger and also rarely walks, he’s a contact hitter and a power hitter).
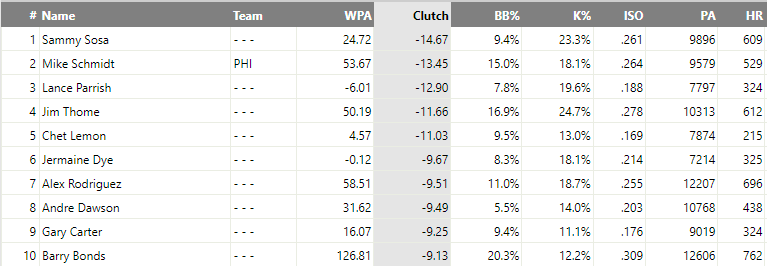
Here’s the bottom of that same list:
Remember, the FanGraphs Clutch calculation compares how much value players added in high leverage situations versus context neutral situations. That is: it compares a player to himself. It doesn’t evaluate whether a hitter was good, it doesn’t tell you which player you’d want at-bat in a high leverage situation (the answer to that question would always be Barry Bonds). It tells you how much better a player performed for his team, in terms of increasing win probability, compared to his baseline performance. The list above is rife with TTO legends. This data makes sense.
Some who’ve read to this point will be familiar with the key input to FanGraphs definition of Clutch: Win Probability Added (WPA). That measure – like all measures – has fans and detractors. To understand why the FanGraphs approach to defining ‘Clutch’ makes so much sense, you have to think about the exceptions to an intuitive idea: that a run equals a run regardless of the context.
A Run Is A Run
This argument seems very strong on its face: runs literally all count for the same value. It really doesn’t matter when the run in a 1-0 game was scored once that game is over. Runs in the first inning are the same as runs in the ninth inning…except not always. Certain situations add leverage to runs. A run in the bottom of the ninth inning of a 2-2 tie leads to a 100% win probability for that game. Any surplus runs scored do not add any win probability for that game. If there’s a runner on third in that situation, a single is as good as a home run. If there are also fewer than two outs, then a fly ball may be just as good as a home run . You get the idea. The implication of this knowledge is that if a player up to bat in a 2-2 tie wants to optimize his approach around winning that game, then he should pursue a strategy that maximizes at least one run scoring. That remains true even if that strategy would lower overall scoring if the situation were repeated infinite times. And that’s because in certain situations, not all runs are created equal. This is what Win Probability Added tries to capture. When combined with FanGraphs Leverage Index, we can measure whether a player adds more to his team’s win probability in high-leverage situations than in context-neutral situations. We can basically measure whether he’s clutch.
It makes sense to score as many runs as possible when you don’t know how many runs you need to win. But when you do know how many runs you need – especially when you need just one – then the strategy that gives you the best chance of getting one run is the best strategy.
The reason why the offense has struggled overall is no secret: catastrophic first half performances from Nola, Crone, Manny, and Xander. But the reason why the Padres haven’t been able to turn a positive run differential into more wins is because they haven’t been clutch. And they haven’t been clutch because they’re a TTO team and rigidly remain a TTO team even in circumstances where a bat-to-ball approach would serve them better. We’ve said it before and we’ll say it again: We wish Tony Gwynn was still playing.
Note: This is part 1 of a 2 part post. Here we talked about a rather shocking observation that despite believing otherwise for the past 20 years, it does look like clutch performance can be measured using dynamic changes in win probability in high leverage situations. But the observation is that it’s more a strategy than an intrinsic skill. Most of you have probably already concluded: it’s one thing to identify a superior strategy in a game situation, but being able to switch to that strategy when it’s called for is something different entirely. We will cover this in part 2. Thank you all for supporting our work.
Part 2 of this article can be found here.
For what it’s worth, Fernando Tatis Jr. is not playing TTO baseball. He’s last in MLB in taking strikes looking, takes the fewest pitches per plate appearance in MLB, and is 7th in MLB in percentage of pitches swung at. He’s taking Tony Gwynn’s approach: he’s up there to hit. But he’s taking mighty hacks when he does.


This is honestly one of the best-written and most explicative pieces I've ever read on clutch hitting. Brilliantly done, sir. Would you be willing to come on Padres Hot Tub and talk about this?