


When your stars don’t perform you shouldn’t expect to be good. The Padres played seven games this past week against the Rockies and Phillies and went 2-5. Xander Bogaerts, Fernando Tatis Jr, and Manny Machado had a combined 4 extra base hits (none of them home runs) across 72 total plate appearances in which they collectively hit .209 with a .547 OPS. These three players have an enormous corpus of data suggesting they are better hitters than their recent performances. But that counts for exactly zero in 2024. They didn’t have it this week. It doesn’t take complex analysis to understand that if they continue to struggle this badly there will be more weeks like this (shudder).
There is a lot of analysis to be done on the other side of the ball. The Coors Field road trip was as horrific as anticipated, capped off by an awe-inspiring meltdown on Thursday as Padres relievers blew a 9-4 lead in the eighth inning allowing six runs to score on the way to a 10-9 loss. It was a loss that felt like the winds shifting. We don’t want to wallow in it, but we’re going to break down an aspect of it that we hope helps us process and move on from a game, and a post-game conference, that we’d like to forget.
We have a basic understanding of why pitchers struggle in Coors: the air is thin so breaking balls don’t break, and fly balls fly further. But we’re getting closer to truly understanding the physics at a granular level. Major League Baseball has made Statcast data publicly available since 2015, however in 2020 the state of the technology underwent a sea-change of sorts when MLB switched from the radar based Trackman technology to the optical based technology of Hawk-Eye Innovations to conduct pitch tracking. The switch to Hawk-Eye ushered in the still nascent era of unprecedented precision in pitch tracking. And there are now many applications using this data to quantify the unique trappings of Coors field. We’re going to use examples from Thomas Nestico (@TJStats), whose applications create beautiful infographics of pitcher Statcast data1, to better contextualize what we saw in that woeful Thursday night game. Here are the basic pitch shapes of Wandy Peralta’s Changeup and Sinker prior to pitching in Thursdays disastrous eighth inning:

Now note the differences in induced vertical break (iVB) and horizontal break (HB) when he pitched Thursday in Coors:

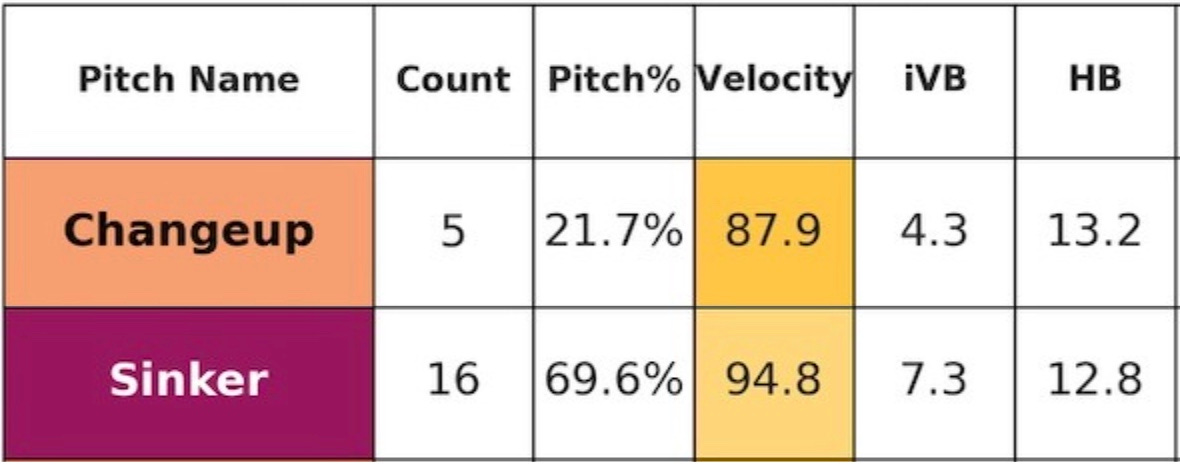
His Changeup has nearly four inches less horizontal break (Arm Side break i.e. away from a right handed hitter) when he pitches in Coors. His sinker has two inches less vertical break and nearly four inches less horizontal break. These differences are typical of pitching in Coors Field.
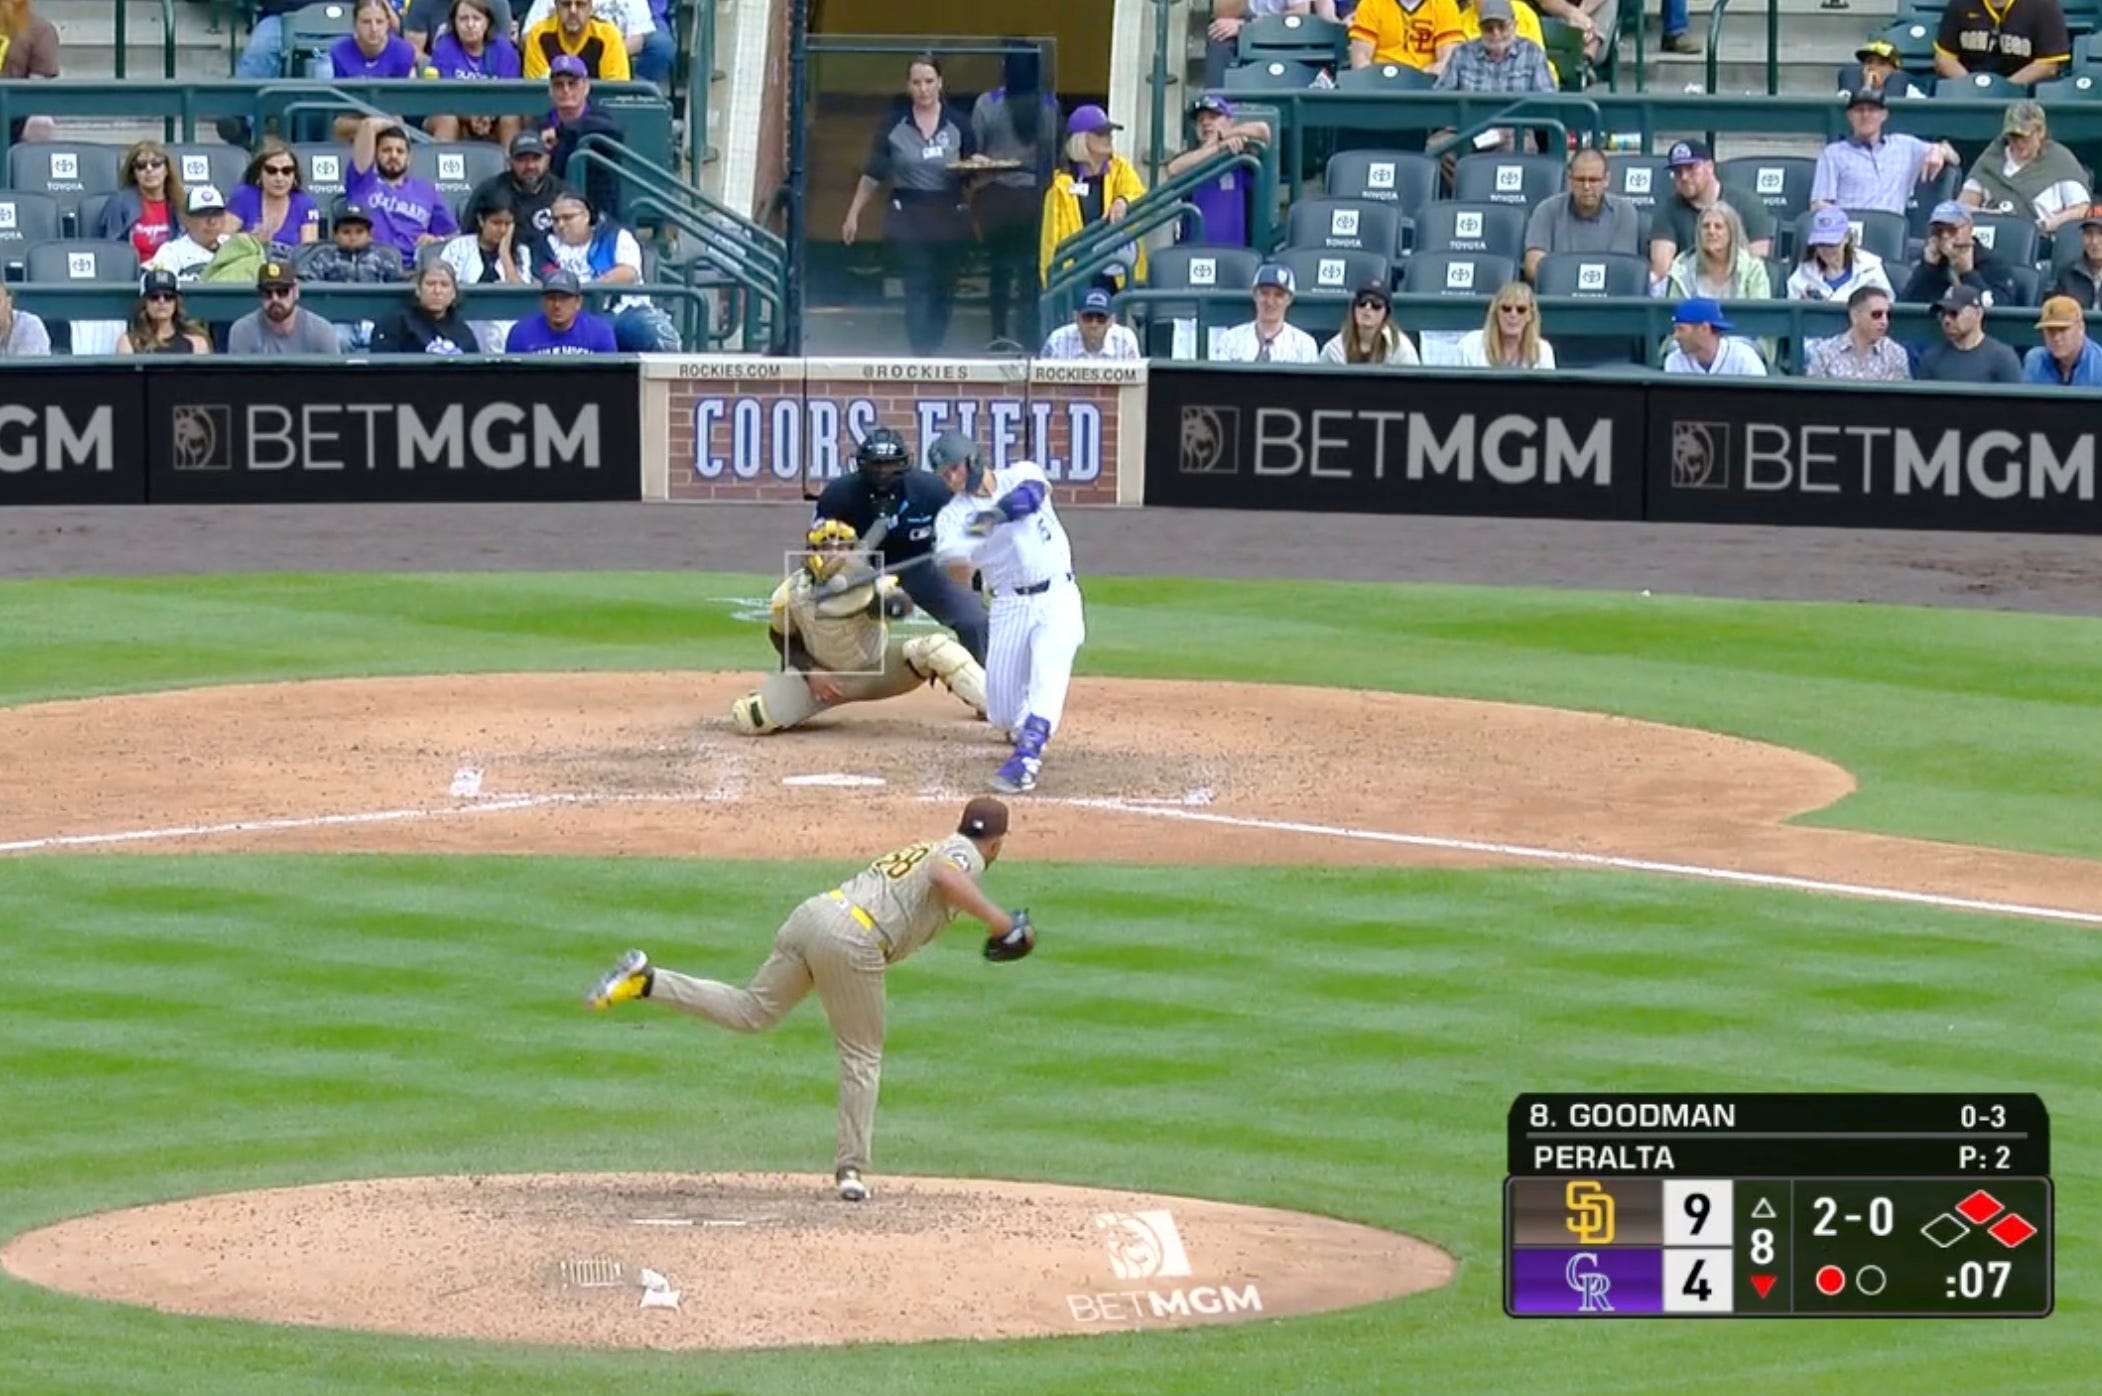
Now let’s watch how this might affect the approach in that dreadful eighth. With runners on first and second, Wandy Peralta fell behind 2-0 to Hunter Goodman. You can see that Luis Campusano flashes a target for the next pitch on the outer half of the plate:

The pitch call was a changeup. A normal Peralta changeup tails away from a right handed batter. Throwing this pitch on the outer half, tailing away from a right handed batter is an attempt to induce weak contact, a pretty sound strategy with runners on base where a ground ball might induce a double play. But here’s where the pitch ended up:
Here’s the still frame of the location of that changeup:
That is the ultimate meatball. A changeup elevated and right over the heart of the plate. No one ever throws a changeup there on purpose, it’s always a mistake. But what’s at the heart of that mistake? Was the badly missed location because Peralta’s release point was off i.e. he simply missed where he was aiming? Or was that pitch in the wrong location because Peralta’s changeup, accessed through muscle memory trained on thousands of repetitions, has four more inches of arm side break in every other ballpark, meaning with the same release point this pitch is on the outer half of the plate pretty much anywhere but Coors? An interesting thought exercise is to envision what the result would have been if that changeup had had its usual extra four inches of arm side run; it probably would have hit the exact center of the target Campusano had flashed… and this raises the question of preparation. Are the Padres pitchers being instructed about what differences to expect in their pitch shapes, and adjusting accordingly? It’s very hard to say based solely on watching game tape, but a tense moment in the post-game conference casts a little bit of doubt on that:
Dennis Lin asked Mike Schildt about leaving Peralta in the game to face five batters when it seemed like “he didn’t really have it from the start”. Schildt bristled at the suggestion that it was obvious Peralta didn’t have it, asking Lin rhetorically “It was obvious to you?” Schildt explained his rational for leaving Peralta in:
“Wandy has about a 60% ground ball rate” He goes on to say: “I got a veteran guy out there that knows how to get a ball on the ground and is one pitch away from getting a ground ball.”
In his career Peralta has pitched 11.1 innings at Coors Field and given up 10 earned runs. That includes 3 home runs, a HR per 9/IP of 2.43. Last year the Colorado Rockies pitching staff led the MLB with 1.5 HR per 9 IP. Peralta has an overall career HR/9 of 1.1. He’s never induced a ground ball double play in Coors. While he did induce two ground balls in his earlier outing at Coors on Wednesday, he also gave up a home run and a deep fly ball. And we know that the source of his ability to induce ground balls, his pitch shapes, are severely distorted at Coors. There is not much evidence that Peralta is in fact a ground ball pitcher at altitude. There is evidence that his past performance in other ballparks may not be a representative sample to forecast his effectiveness in Coors field.
Schildt was answering questions extemporaneously to the best of his ability, and we don’t mean to be too harsh. But, it’s fair to notice that these comments suggest Schildt and the Padres don’t view their pitchers any differently when they’re pitching in Coors. We have the technology to demonstrate the differences in pitch shapes at altitude, and when pitch shapes are fundamentally different, this implies a different optimal strategy. If you can articulate a pitch’s shape, you can anticipate that pitch’s outcome, and you can strategize from there. This is not in any way to say that identifying and executing that optimal strategy is easy. This is just to point out that it sounds for all the world like the Padres brass are thinking about their pitchers as being fundamentally the same when their pitches are fundamentally not.
It may be that the Padres analytics department and coaching staff have completed rigorous analysis and concluded that there is no better strategy to be found. It seems more likely that the rapid pace of technology has created new depths to mine for slivers of win-probability that are as yet not fully explored. But at the very least, this better understanding of the physics of the game should leave us reticent to apply past performance in other ballparks to forecast outcomes in Coors.
The Padres have until mid-August to develop a better approach to pitching successfully at Coors Field. Let us not speak of that damnable place until then.
Available at his patreon page: patreon.com/tj_stats
Excellent analysis. The decision to use Peralta should not be viewed in a vacuum, though. Schildt almost certainly knows that Peralta's stuff is impacted by the environment, but he also knows that his other pitchers' are affected in similar fashion. He may have determined that Wandy had the best (or least bad) chance of success among the available options. A manager has to use his entire roster, and sometimes guys are used in their ideal role and shit the bed anyway. Keep up the great posts. I don't know who you are, but your work is terrific.