
Metamorphosis
Changing Conventions

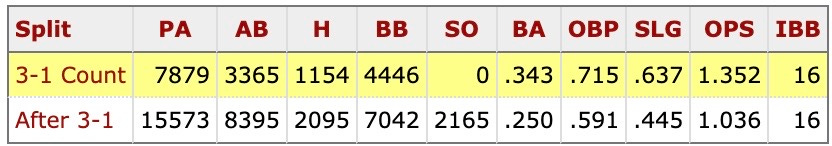
At the start of an at bat a player is who he is. But with every pitch, you are pitching to a different hitter. Here are the MLB average batter’s performance broken down by count from 2023:
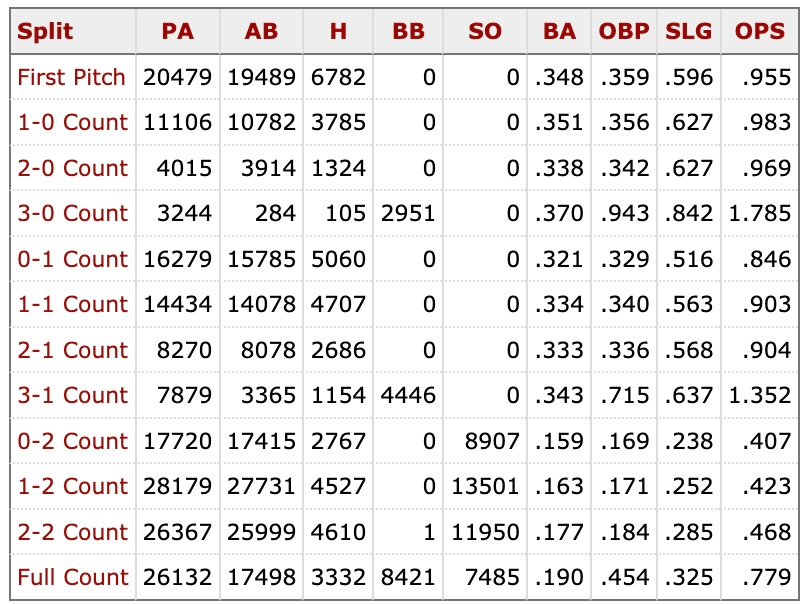
In 2023 major league hitters had a 1.352 OPS with a 3-1 count. To put that in perspective Barry Bonds once hit 73 home runs and walked 177 times in a single season, and his OPS that year was 1.379. The average major league hitter becomes Barry Bonds with a 3-1 count. But Matt Chapman is exceptionally good in these situations with a career 1.583 OPS in 3-1 counts.

In Sunday’s game against the Giants the Padres provided another, to borrow a phrase from Major Garrett, mindless excruciating loss. And the pivotal moment deserves some exploration.
The Padres were clinging to a 2-1 lead in the bottom of the eighth with one out. Jhony Brito induced Michael Conforto to hit into a seemingly inning ending double play. But Ha-Seong Kim did not hold on to the throw from Cronenworth:
Courtesy @JomboyMedia
The error prevented the Padres from ending the inning, and the situation was now a tied game with a runner on third and two outs in the bottom of the eighth with, you guessed it, Matt Chapman coming up to the plate.
Matt Chapman worked the count to 3-1. And this is the point where the Padres had a critical opportunity to put their thumb on the scale of fortune. When the at bat started Matt Chapman was Matt Chapman. But once the count was 3-1 his expected performance was better than apex Barry Bonds. Now, the 3-1 stats contain some survivorship bias, so it may be more instructive to look at Chapman’s career stats after seeing a 3-1 count1:
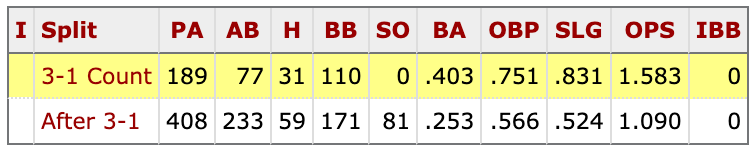
Continuing to pitch to Chapman once he’s worked the count to 3-1 is choosing to pitch to a much more effective version of Chapman. So why pitch to him there when Thairo Estrada is in the on deck circle? Conventional run prevention strategy has become all about limiting batters reaching base, because more runners on base leads to higher run totals across the season. Walks are anathema. And indeed walking Chapman does increase the run expectancy for the inning from .413 to 4.71 per Fangraphs. And on its face that seems to answer the question about whether putting Chapman on base is a superior strategy to pitching to him 3-1: it leads to more runs over the long term so it’s the wrong strategy. But the cognitive mistake here is thinking that simply minimizing the number of runs scored in the long term is all that matters. Games are played in nine inning blocks, so when it’s late in the game and the team has a much better idea of how many runs are needed to win/lose the game, it makes sense to switch from a strategy that might maximize total run prevention across infinite iterations of the inning, to one that maximizes the chance of surviving that game. We’ve written about this idea on offense. This is the run prevention Monty Hall problem. The optimal strategy for run prevention can change when you gain knowledge about how many runs you need to prevent.
And there is evidence to support this. Greg Tolls created a famous win expectancy calculator2, and from this there is an implied best situational strategy that aligns with what is described above. At the very least, the above implies an optimal strategy of not giving Chapman a pitch to hit once the count reaches 3-1.
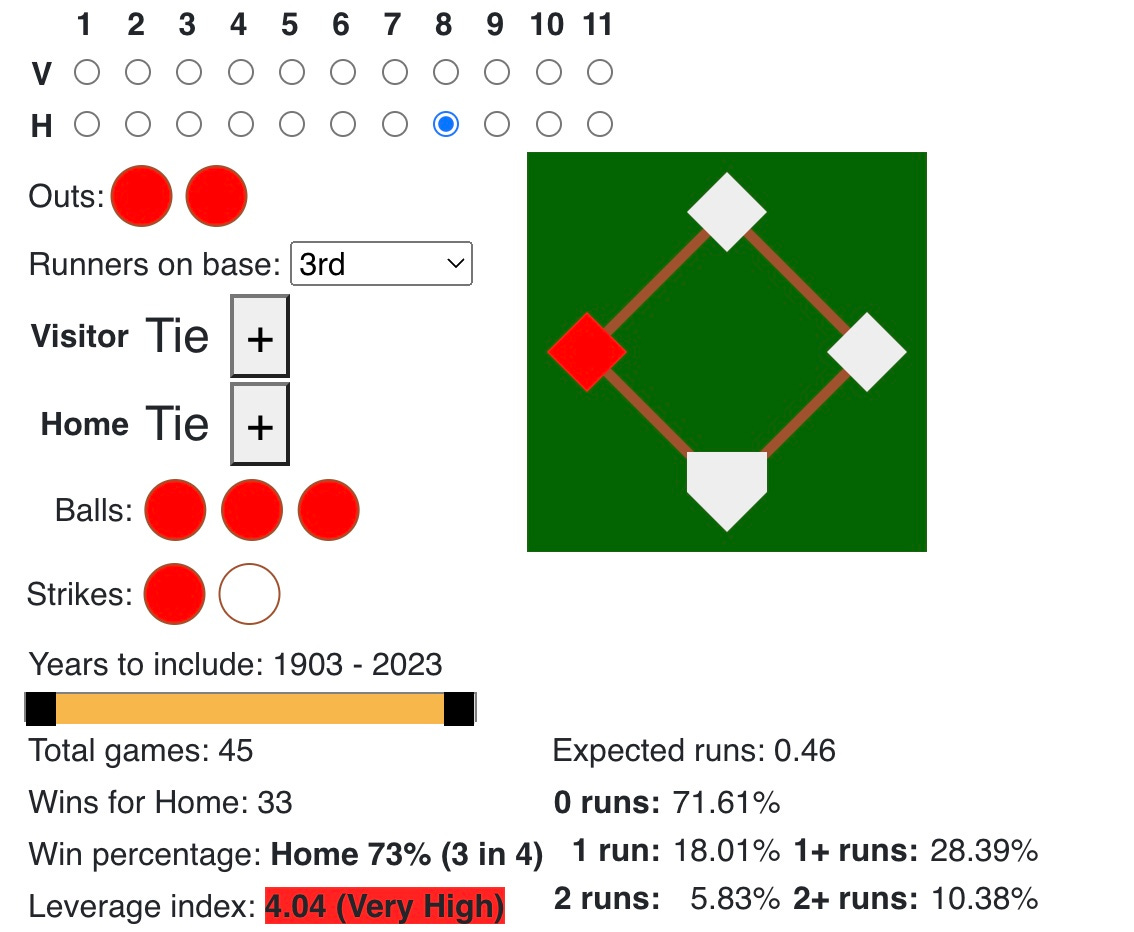
Since 1903 home teams with a runner on third, two outs, tie game, bottom of the eighth, and a 3-1 count win the game about 73% of the time. But look at what happens when a teams has runners on first and third with two outs and a 0-0 count:
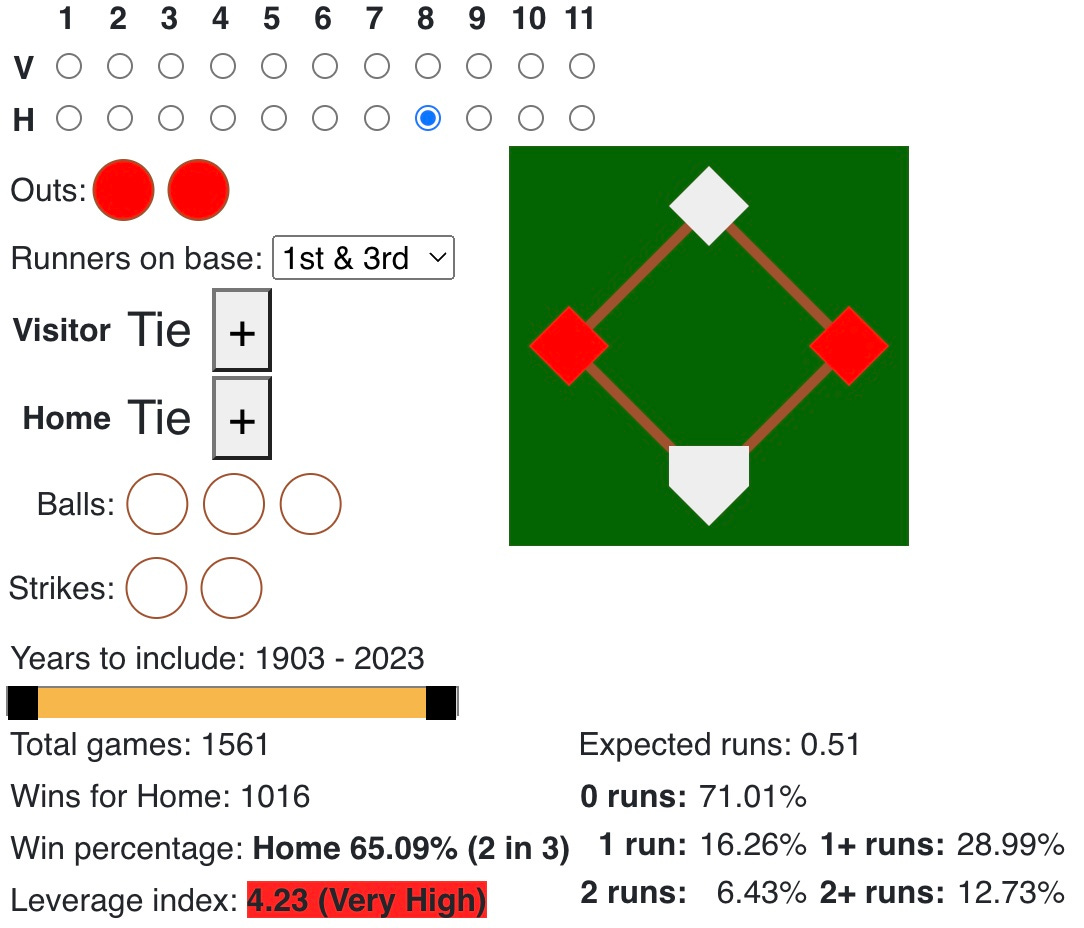
The win probability actually goes down even though the total expected runs is higher.
These effects are much more pronounced when looking at games from the past 20 years (2003-2023) as advanced analytics took hold across the league:
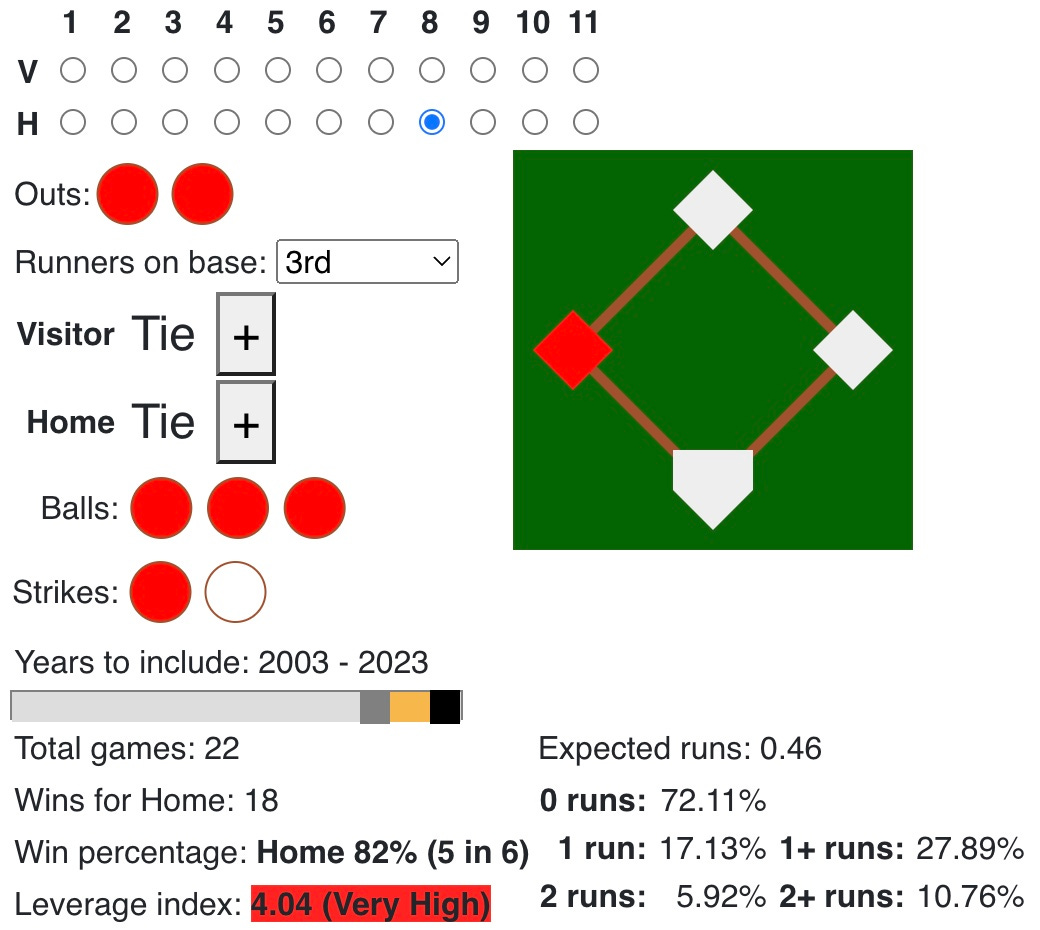
When home teams have a runner on third in a tie game with two outs in the bottom of the eighth and a 3-1 count they win that game 82% of the time.
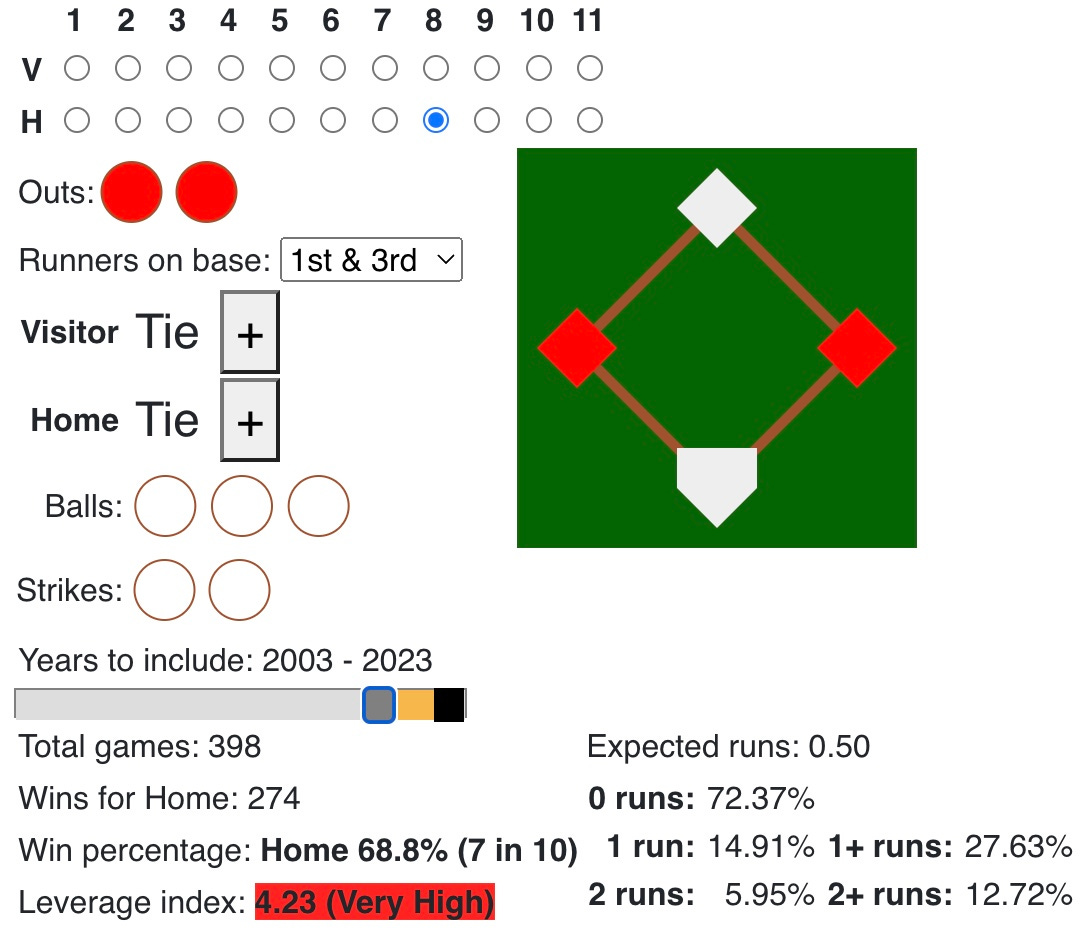
But, if a team has runners on first and third in a tie game with two outs in the bottom of the eighth and a 0-0 count they win only 68.8% of the time:
And although the expected runs in the inning go up in the latter scenario, the percentage of innings where they score at least one run goes down. This implies a situationally optimal strategy which is either to walk the batter, or at the very least, do not throw him a pitch to hit. This is what Matt Chapman saw from Jhony Brito with a runner on third and a 3-1 count in the bottom of the eighth in a tie game on Sunday:
Courtesy @TalkinBaseball_
This is Padresing. There was extra win probability to be had that involved a strategic choice the Padres could have made. You don’t have to throw Chapman a strike there. You can reset the game. Take out the cartridge, blow out the dust, and start over with the weaker Estrada and a fresh 0-0 count.
There was more to this game. Kim’s errors directly led to runs being scored. But the point here is that errors from a good defender are most likely the result of bad luck and not some process that Kim or the team has agency over. But that’s absolutely not the case when choosing to pitch near the strike zone to a hitter like Chapman with a 3-1 count and the game script playing out as it had. That’s a choice. And even with a pitch clock rushing pace of play these scenarios can be game planned for. Every play in baseball is a set piece. There only 24 different base-running states. There are only 12 different pitch count states. That’s 288 total starting alignments before every pitch. That’s an accessible number of scenarios for an analytics team to plan game script around. To be situationally aware.
This raises the question of whether the team is in fact strategizing to this degree of granularity. It should be possible to realize when the pitch count has summoned Barry Bonds to the plate. And when it’s a matter of survival to ensure that all important first run doesn’t score, the game optimal strategy may be to do exactly as so many teams did when Bonds broke baseball: give him the walk.
Despite trade rumors circulating all week, the die is largely cast. The Padres do not have a lot of roster flexibility. This is the team. They are not going to blow the league away. Games are going to be close all year long. It’s plausible that surviving the regular season is going to be the ability, across 162 games, to loot a couple more wins through chasing slivers of win probability, collected painstakingly through elite decision making across the parts of the game they can control. What’s distressing is it doesn’t seem like they are doing this consistently. They are clearly chasing the low hanging fruit: platoon switching is the rule so far in 2024, they’re taking the extra base. But they are missing the metamorphosis: the optimal strategy that changes throughout the game. Indeed, with every pitch.
This is largely in line with the performance seen league wide in 2023.
From the site: This data is from MLB games from 1903-2023, including postseason games. Data are complete back to 1973, mostly complete back to 1950, and somewhat complete back to 1916. It omits games that are less than 9 innings (doubleheaders in 2020) as well as extra inning games where a runner starts on second base (non-playoff games since 2020). All data is available at Retrosheet.
This is great, you're great! That's all.