

Shildt's Gambit

Mike Shildt’s decision to take a run off the board for the Padres in the fifth inning Tuesday night led to a higher run expectancy for that inning. And for many that’s enough to say it was the right decision. We’re going to argue that it’s more complicated than that. And this might raise the ire of some sabermetric mavens. That’s a risk we’re going to take. And in fact risk is the exact consideration that makes Shildt’s gambit so interesting. First we’ll re-enact the scene:
In the bottom of the fifth with the Padres leading 1-0 Jake Cronenworth came up with one out and runners on first and third. He hit a dribbler for a ground out to the second baseman that scored Tyler Wade from third and advanced Fernando Tatis Jr to second:
This left the Padres with a 2-0 lead with two outs and a runner on second. But the umpires noted that on the play the catcher’s glove interfered with Cronenworth’s swing as you can clearly see if you watch the tip of Cronenworth’s bat:
In this situation a team may decide to accept the organic outcome of the play and disregard the catcher’s interference, or to accept the call of catcher’s interference which awards the batter first base similar to a walk. And this set up a dilemma for Mike Shildt. His options were:
Take the ground out and the run scored for a 2-0 lead with a runner on second and two outs
Accept the catcher’s interference leaving the score 1-0 and loading the bases with one out
Most teams make this decision using the run expectancy matrix which predicts the expected runs scored for the rest of the inning given a particular base/out state:

Shildt was choosing between the two highlighted states above. With the bases loaded and 1 out a team is expected to score 1.520 more runs that inning. With a runner on second and two outs 0.305 more runs are expected to score, so adding the one run that would have already scored gives a total expected runs scored of 1.305.
1.520 - 1.305 = 0.215
So Shildt chose to take a run off the board in order to pursue the base/out state that had 0.215 more expected runs in the inning. The original run expectancy matrix above was created in 2014, but the great Greg Stoll has since created an incredible tool that analyzes the true outcomes of the 185,601 games played from 1903-2023, and according to this more updated data set the expected runs scored with bases loaded and one out are 1.57, and with a runner on second and two outs 0.33. Doing the math here is even more favorable:
1.57 - 1.33 = 0.240
So it was a even better decision that we first thought, right? An extra 0.240 runs? How can that be wrong? Well, there’s one very important consideration that isn’t addressed above. Risk. Shildt chose the strategy that over infinite replays of the inning would produce the higher average runs scored in the inning. But here is the distribution of outcomes underlying the 1.57 expected runs scored:
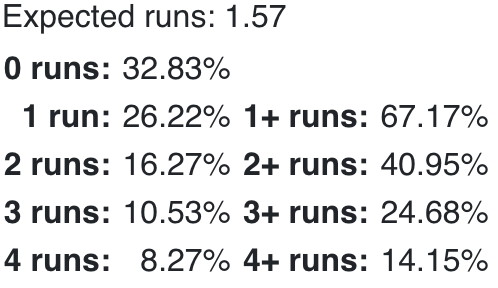
This is a very different distribution of risk than the scenario where Shildt takes the guaranteed one run but lower total expected runs scored for the inning. The strategy that produces the higher 1.57 expected run total also carries a 32.83% chance of scoring zero runs. And here’s the fine point that needs to be understood: the appropriate amount of risk to take in pursuit of more total expected runs over infinite iterations of the inning changes depending on the game situation. We’ve written about this time and again. Shildt’s dilemma finally delivered a crystalized scenario to illustrate the point, and he truly got to choose which strategy to pursue. Here’s what the true outcomes of the 185,601 games played from 1903-2023 say about the win expectancy for the home team when faced with Shildt’s dilemma inning by inning:

Shildt’s gambit, choosing the bases loaded one out state with the higher expected runs scored, gives the higher win expectancy in the first and second inning. But by the third inning the win expectancy is higher for the strategy that guarantees at least one run scores, even though fewer total runs are expected. And this makes sense. The fewer innings there are left to play, the fewer chances to recover from the 32.83% of outcomes where a team rolls snake eyes with the bases loaded. There is more leverage on the intrinsic risk of this strategy when there are fewer chances to recover. By the same token, taking a guaranteed run later in the game leaves the opponent with fewer chances to score before the game is over. The differences in timing affects win probability. The optimal strategy changes as the game goes on. Shildt made his gambit in the fifth inning which was a decision that has historically led to an 82.37% win expectancy for the game. But taking the guaranteed run in the fifth inning has historically led to an 84.42% win expectancy. That’s a difference of 2.05%. Across 162 games that would be a difference of more than 3 wins by taking the lower run expectancy strategy.
You’ll notice the chart above doesn’t cover the ninth inning, and that’s because in both of the scenarios above the team starts with the lead, and if a team has the lead in the bottom of the ninth they win. So as a final exercise let’s examine Shildt’s dilemma in a tie game in the bottom of the ninth. In this situation Shildt’s gambit would yield the following base/out/inning state:

Shildt’s gambit has played out 3,257 times in the bottom of the ninth inning in a tied game, and the home team has won 86.54% of those games. But if you’ve been following so far you’ll understand that you don’t need a data set to know the win probability of the strategy of taking the guaranteed run. Because in the bottom of the ninth inning of a tied game, scoring a run carries a win probability of 100%. Scoring a run in this situation is deterministic. Taking a guaranteed run guarantees the win. The R-squared is 1. Here are the effective choices in Shildt’s dilemma in the bottom of the ninth of a tied game, framed not as run expectancy but as win expectancy:

There’s no choice at all. The correct answer is the strategy that leads to fewer expected runs.
All this is to illustrate how counterintuitive identifying the winningest strategies can be. It’s sabermetric anathema to trade outs and run expectancy for a higher run scoring floor. But it shouldn’t be. Not always. Because situations dictate the tradeoffs in risk and upside that optimize win probability, and linear regressions run on the relationship between scoring runs and winning games use enormous corpuses of box score data that strip all the context away. But let’s add one more wrinkle before reaching our conclusion.
There’s a piece of analysis we haven’t covered, and it’s important to the final judgement of Shildt’s gambit. Here’s Mike Shildt describing how he made the decision to pursue the higher expected runs strategy:
Courtesy @973TheFanSD
He’s not talking about expected runs at all. Shildt’s focus was not the historical data, although he was aware of the higher run expectancy of his gambit. His focus was on the granular details of the situation. Run expectancies are calculated by the averages of thousands of innings, a composite of all the league’s hitters, good and bad, who’d faced the same situation. For Shildt it mattered that it was one of his best hitters coming to the plate, and that’s important extra context to consider:
Courtesy @Padres
Mike Shildt won the game with kept faith. Faith in Manny Machado. And while there’s historical data that suggests taking the strategy with lower expected runs scored would have increased the Padres' win probability, the marginal difference was only ~2% and was based on average hitter outcomes. Shildt appropriately factored in that it was not an average hitter coming to the plate, and this nudged his calculus.
That was an incredible moment, an all time hypothetical playing out in real life. And the Padres needed the extra runs that gambit allowed. Mike Shildt made a great call, just maybe not for the reasons that we first assume. It broke a horrid losing streak. We can’t know how much of a reprieve we’ll get, but at least on Tuesday the baseball, and decision making was riveting.
Today I learned that "deterministic" is a word. The expectancy matrix is a good baseline from which to start the internal debate that Schildt certainly had. In addition to considering which players were due up next, whether those players were feeling good that day, how the guy on the mound for the other team was throwing, whether we had our best relievers available to protect a slim lead should he choose to accept that lead.... blah blah blah. It's a complicated game and a manager probably knows dozens, or even hundreds, of things about what's going on with his players that day thet we are unlikely to ever know. But it sure is fun for us to talk and read about it. Terrific work on your part, as always.
I'm glad you wrote this article. You explained the situation very well. Is another way of thinking about the gambit have anything to do with thinking about the events and situation in a game being dependent upon what has happened before, and perhaps after? I mean, the expectancy matrix seems to assume that the events and situations at those moments are independent of the rest of the game. That is not the case. For example, you mentioned Manny being up to bat, which certainly creates better odds than, say, Trent Grisham--two very different hitters. The expectancy matrix doesn't seem to take into account how well the pitcher has been performing, or who is on the basepaths, either.
I have to admit, while watching that game, and given the Padres difficulty scoring runs in the previous 5 games, I was screaming at the TV, "Take the run, Mike! Take the run! I don't care what the odds are or have been for every other team throughout history, this team, in this moment, has not been scoring!" But, boy, was I glad to be wrong. Manny came through. It was a big moment that I am glad I witnessed.