The sands have shifted beneath the Padres feet. Since August 15th the team has seen its ace Michael King return to the IL, Xander Bogaerts sidelined with a fracture in his foot, Jackson Merrill taking yet another stint on the IL in his injury plagued second year, Fernando Tatis Jr miss time with a vague hamstring injury, and the sterling season of Jason Adam come to a premature end with a ruptured quadriceps tendon. The path ahead no longer runs flat but rises steeply, made more difficult by the passing of the September 1st deadline to add playoff eligible talent from outside the organization. Any improvement the team might see down the stretch will need to come from in-house. The task is to find efficiency in the resources that remain. And that demands a sober reckoning. In the next few articles we’ll explore several season long trends in which the Padres can still exercise agency, either changing course, or continuing the practice they’ve employed all season. This will not fill the breach. Nothing can. The 2025 Padres are permanently weakened by these events. Which is why the margins call for attention. First up: Small Ball.
Small Ball
After another loss on Monday the Padres record stands at 76-62, a .551 winning percentage. Much of the Padres success in 2025 has come through protecting narrow leads with a lock down bullpen. Jason Adam’s season ending injury is an enormous blow to this win formula. The Padres bullpen is better equipped to absorb this loss given the addition of Mason Miller at the trade deadline. But it’s nonetheless going to be more difficult to protect narrow leads. And so, with a month to go in the season it is fair to consider the wisdom of the team’s heavy use of small ball across the season, especially the sacrifice bunt.
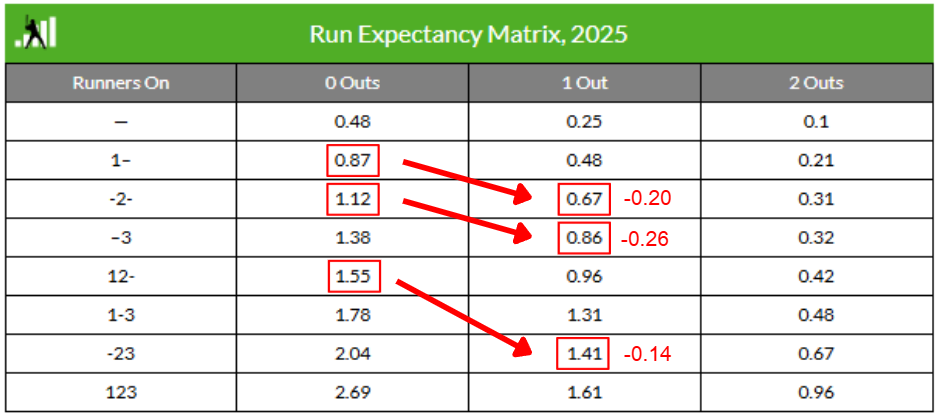
It’s been almost 25 years since analytics swept away a century of received wisdom about the use of bunts, and correctly identified that the use of the sacrifice bunt always carries a decreased run expectancy. This is easy to visualize using the run expectancy matrix (which Fangraphs updated through the 2025 season) to map before-and-after base/out state changes created by sacrifice bunts:
And baseball certainly has taken notice of this with bunt usage reaching its nadir in the past five seasons (though it took almost a decade after the analytic revelations were first published for the decline in the use of bunts to take hold):
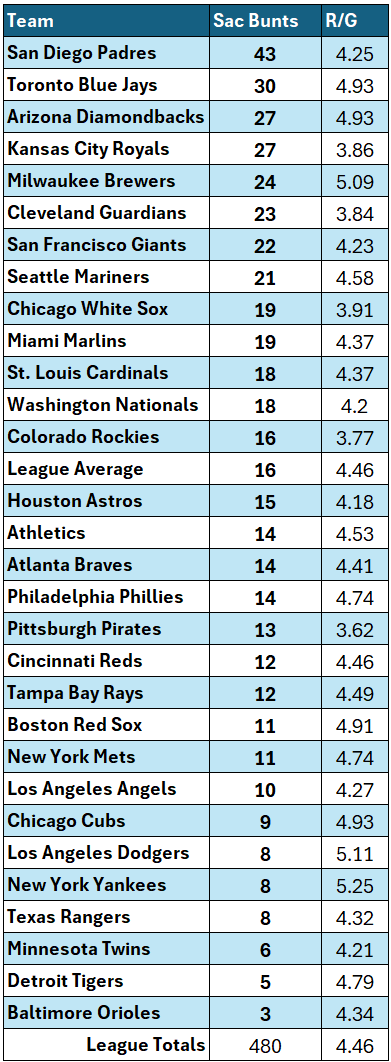
The sacrifice bunt has become one of the most loathed plays in the sport because of the irrefutable observation that it decreases expected run scoring. And that’s been a well-founded source of consternation from Padres fans watching an offense that is near the bottom of the league in runs scored drop sacrifice bunts again and again. Unsurprisingly the Padres lead baseball by a wide margin in sacrifice bunts:
This is only the chart of the successful sacrifice bunts the Padres have attempted. There’s a failure rate to attempting a sacrifice bunt as well:
Including both successful and unsuccessful attempts (as well as those attempts that unexpectedly became hits), the Padres have attempted sacrifice bunts 58 times across 44 games this season. They’ve attempted a sac bunt three times in a single game (an entire inning worth of outs) an astonishing five times.
You can make a ballpark estimate of how many runs this has cost the team across the season. On average a sacrifice bunt costs a team ~0.20 runs, so 58 attempts has cost the team about 12 runs using the run expectancy estimates. That’s more than enough runs to have swung the outcome of a few games.
It’s worth asking why, with the crystal clear understanding that sacrifice bunting reduces expected run scoring, a team would lean so heavily into the practice? This has an answer that is easy to understand. Although it’s invisible in the run expectancy matrix, there’s a tradeoff between total run expectancy, and run scoring distribution when moving between the base/out states that shift after a successful bunt.
It turns out that while sacrifice bunting always decreases the total run expectancy, it frequently increases the likelihood of scoring at least 1 run. The tradeoff for fewer total runs is a lower chance of coming up completely empty. And if you understand baseball, you can instantly see why in the right context this is an extremely favorable tradeoff for the purpose of winning the game. But the key is that context is everything. And some sacrifice bunts are almost pure downside.
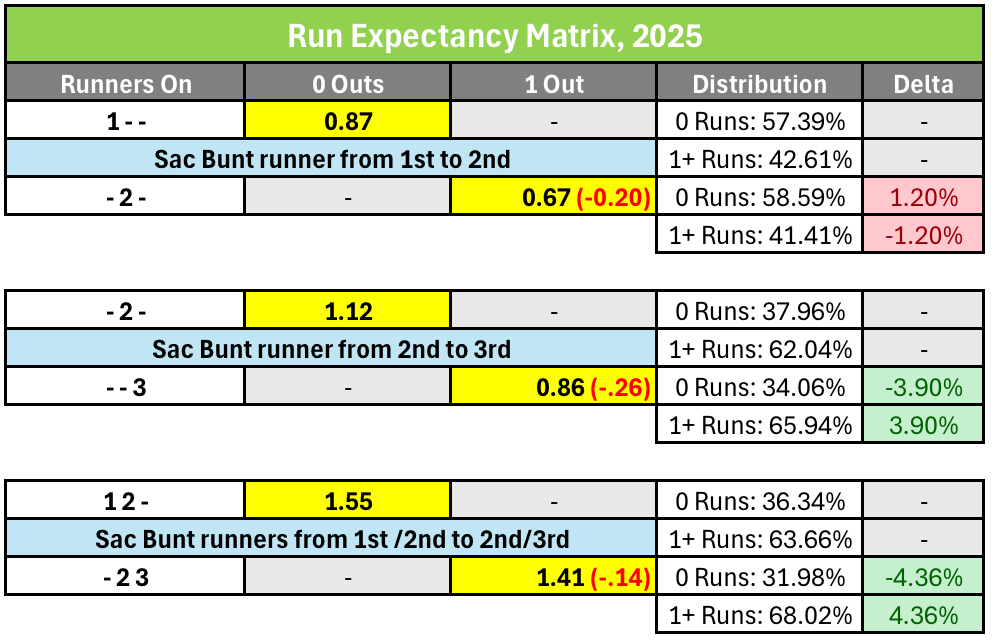
Here’s a visualization of the three most common sacrifice bunt contexts, and the tradeoffs between run expectancy and run distribution:
While every successful attempt decreases expected runs scored, sacrificing runners from 2nd to 3rd, or 1st/2nd to 2nd/3rd significantly decreases the likelihood of ending the inning with 0 runs scored, and significantly increases the likelihood of scoring at least 1 run.
In the late innings of very close games when there are few remaining chances to score, scratching across a single run will accrue enormous swings in win probability. In the bottom of the 9th or later in a tied game, scoring a run becomes deterministic: a single run wins the game. The increase in the likelihood of scoring at least 1 run is completely congruent with the increase in win-probability in those situations.
Very few games actually lead to the deterministic scenario above, more often there is significant uncertainty about how many runs will be needed to win. A smart team will forecast this based on the game context. Early in the game they will consider whether their starting pitcher is likely to hold the opposing team to very few runs. Later in the game they will assess whether the high-leverage bullpen arms are rested and available to lock down a close win. The uncertainty is highest in the 1st inning, and by the bottom of the 9th the home team always knows exactly how many runs it needs to win. Decisions about whether to sacrifice bunt become more certain as the game progresses. So there are two considerations that imply whether a team is being smart or capricious with their sacrifice bunt choices:
The inning they have attempted sacrifice bunts, and
The base/out states they are bunting in
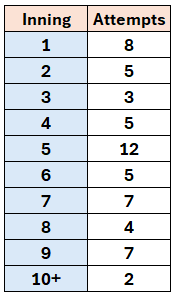
And here there are some mixed findings. These are the bunt attempts per inning:
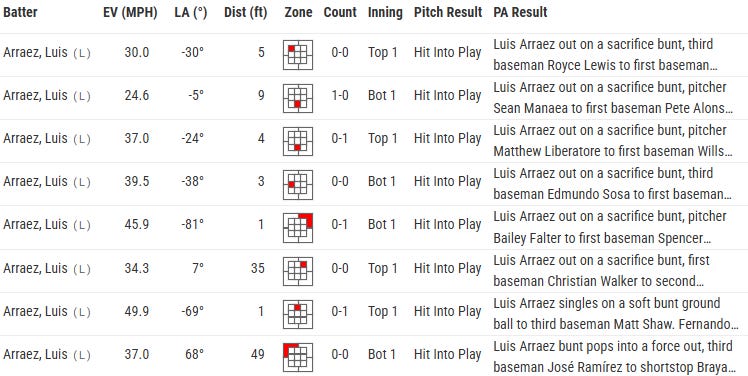
The Padres have attempted the most sac bunts in the first five innings (33), well ahead of the next closest team (Rays, 23). And they’ve sac bunted eight times in the 1st inning (when the trade off of more total runs is least justifiable since the uncertainty about how many runs will be needed to win is at its highest). A deeper look at those 1st inning bunts is even more troubling, because all eight attempts have been the same context:
Luis Arraez has attempted a sacrifice bunt to move Fernando Tatis Jr to 2nd base all eight times. And beyond the uncertainty present so early in the game, these are all pure downside sac bunts where both the run expectancy and the run distribution move to less favorable states:
Luis Arraez has been under the microscope for other swing decisions all season (we’ll dissect that in Part 2 later this week). But his bunt decisions in the 1st inning have been indefensible, at least from any angle we can see. If you accept the typical WAR definition of a decrease of 0.20 in run expectancy representing a ~2% decrease in win probability you can get at why this really matters. Small percentage swings in win-probability become impactful when you scale them across a season:
162 games * 0.01 = 1.62 wins
162 games * 0.02 = 3.24 wins
162 games * 0.03 = 4.86 wins
162 games * 0.04 = 6.48 wins
The best time to purge a small win-probability drag is the start of a long season. The next best time is now. And this is something the Padres can simply decide is no longer an acceptable strategy in the 1st inning of games and increase their win probability across the remaining month of the season.
The 1st inning calculus is fairly cut and dry. But how deeply should the purge of the sac bunt go? Looking at their record in games in which they’ve attempted sac bunts shows some surprising results:
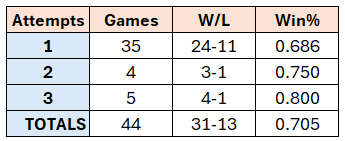
They’ve gone 31-13 in games in which they’ve attempted a sacrifice bunt. And they’ve accrued their best record in games in which they’ve attempted three sac bunts (albeit small sample sizes):
Again, the aggregate run expectancy change from the 58 sac bunt attempts above is -12 runs across 44 games. Typically that’s a devastating loss of productivity. But it’s very hard to believe that they could’ve done much better than a .705 winning percentage across those games. For reference the Milwaukee Brewers have the highest winning percentage in baseball at .612 (85-54).
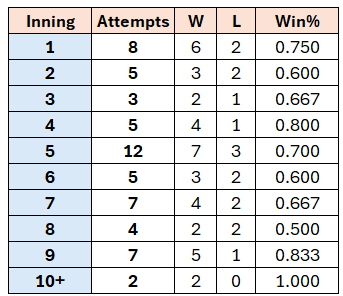
The key to reconciling the paradox between sacrifice bunting costing a team runs, and the team performing so well in the games in which they attempt sacrifice bunting is that sacrifice bunts are not random. They’re a choice, always. The opposing team can’t force you to do it. And not every game is going to present an opportunity where a sacrifice bunt is acceptable (at least it shouldn’t). So outside of the egregious 1st inning pure downside bunts, it’s likely that something about the game context implied that a sacrifice bunt, while decreasing run expectancy, made some strategic sense. Here are the W/L outcomes in games with sac bunts by inning1:
The 9th inning or later is when the team has the most information to use to make a sound small ball calculus, and they’ve gone 7-1 when bunting in these late innings. Results are a lot more mixed when they’ve bunted earlier, though they still have a 24-12 record in those games (.667 winning percentage).
We’ve watched every game this season and like many (most?) the frequent bunts looked to us like a primitive brain-trust relying on obsolete tools in a modern landscape that had left them behind. That still might be true, 44 games is just not a large enough sample for ironclad conclusions. But diving into their sac bunt tendencies was surprising. We’re not ready to foreclose on the possibility that there is offensive efficiency to be had here. But it requires more disciplined deployment of the ancient tools.
This is minutiae. It’s deep in the margins. But this is where the team needs to be looking for efficiency. Because the ability to add significant player talent to the roster is largely out of the team’s direct control. Nothing above is meant to paint a rosy picture. Attrition has put a hard-fought season under siege. These are the twists of fortune that so often shape the campaign of postseason aspirants. This is the game. It’s not supposed to be easy.
Games with multiple bunts will be double counted on this chart, there’s no clean way around it; but the overall record of 31-13 in games with at least one sac bunt represents 44 distinct games.





Another master class . Open up paid subscriptions please, I feel guilty reading your gems for free
The first inning bunts and bunting a runner from first to second with nobody out drives me insane. 6-2 is hard to argue with, but by the same account correlation does not always mean causation. The run expectancy matrices have a much larger sample size than the Padres individual bunt outcomes, and those numbers don’t lie. But like Craig says on Padres Hot Tub, the tin foil conspiracy theory is that Arraez figures his average doesn’t go down when he sac bunts.😂
Whoever works the analytics department for the Padres is either banging their head against a wall, or being paid for their silence.